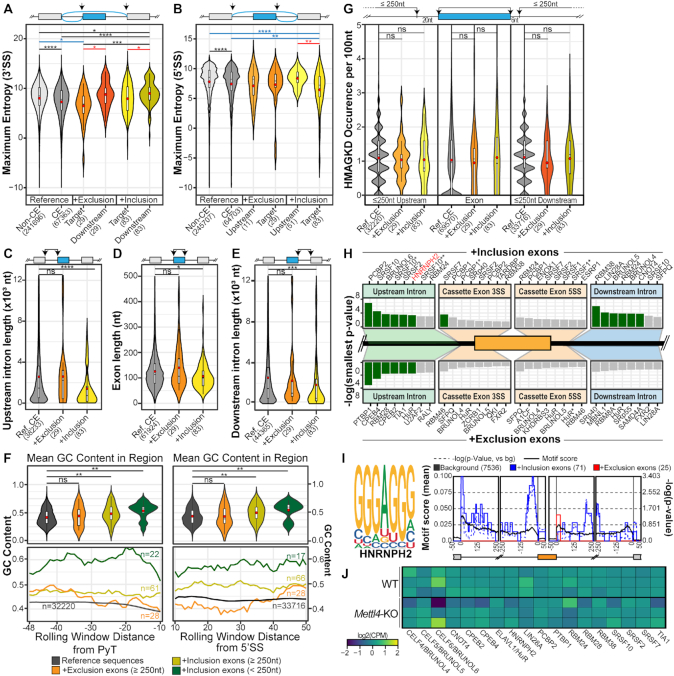
Figure 5.
Features of affected METTL4-dependent splicing events. (A, B) Violin plot of the 3′ and 5′ splice site maximum entropy score of all human non-cassette exons (‘non-CE’), all human cassette exons (‘CE’), exons undergoing increased inclusion or exclusion (‘Target’), as well as their downstream exons for 3′ splice-site strength analysis and upstream exons for 5′ splice-site strength analysis. Mean values are indicated as red circles and group sizes are indicated within parentheses along axis labels. Statistical significance was calculated between all groups using the Kruskal-Wallis test with the Benjamini–Hochberg correction. (C–E) Violin plot of exonic and flanking intronic lengths of all human cassette exons (‘Ref. CE’), and exons undergoing increased inclusion or exclusion. Mean values are indicated as red circles and group sizes are indicated within parentheses. Statistical significance was calculated against the background cassette exons subset using the Wilcoxon Ranked Sum test with the Benjamini-Hochberg correction. (F) Rolling window line plots (bottom) of the GC content in the 48nt region upstream of the polypyrimidine tract (PyT) and 50nt region downstream of the 5′ splice site 6nt conserved sequence. The four datasets include all cassette exons in the human transcriptome, the downregulated exons with flanking intron lengths ≥250nt and the upregulated exons with flanking intron lengths of either ≥250nt or <250nt. Violin plots represent the mean overall GC content of these regions per dataset. Mean values are indicated as red circles and group sizes are indicated within parentheses. Statistical significance was calculated against the background cassette-exon subset using the Wilcoxon Ranked Sum test with the Benjamini-Hochberg correction. (G) Violin plots of the ‘HMAGKD’ motif occurrence frequency in exonic and up to 250nt of upstream and downstream intronic sequences. Datasets include all human cassette exons (‘Ref. CE’), and the exons undergoing increased exclusion or inclusion. Mean values are indicated as red circles and group sizes are indicated within parentheses. Statistical significance was calculated against the background cassette exons subset using the Wilcoxon Ranked Sum test with the Benjamini-Hochberg correction. (H) List of enriched RNA binding proteins in the plotted regions as detected by rMAPS. Green bars indicate statistically significant hits after Bonferroni correction. Exons undergoing increased inclusion (top-half, n = 71 after filtering by rMAPS) and those undergoing increased exclusion (bottom-half, n = 25 after internal filtering by rMAPS). Asterisks indicate distinct binding motifs of RBPs that are known to recognise multiple sequences. (I) Binding motif of HNRNP-H2 and the rMAPS derived regions of enrichment for this motif within the differentially spliced cassette exons. (J) Gene expression heatmap of RBPs identified by rMAPS, plotted as log2(counts per million) values. ns, *, **, *** and **** respectively denote P > 0.05, P ≤ 0.05, P < 0.01, P < 0.001 and P < 0.0001.

