Figure 1.
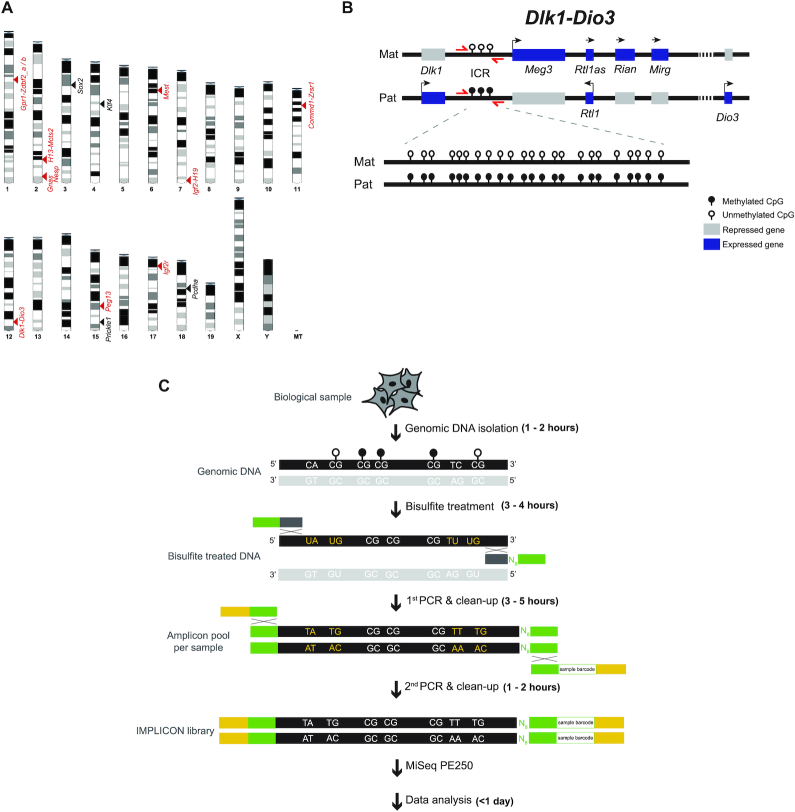
The IMPLICON method. (A) Schematic view of the murine karyotype depicting the location of the regions detected by IMPLICON; black arrowheads – control regions; red arrowheads – imprinted regions. (B) Schematic representation of the mouse Dlk1-Dio3 imprinted cluster; Mat – Maternal inherited chromosome; Pat – Paternal inherited chromosome; ICR – imprinting control region; red arrows – primers to amplify Dlk1-Dio3 ICR; genomic region is not drawn to scale. (C) Brief scheme of the IMPLICON method and its approximate timeline; bisulfite treatment of genomic DNA converts unmethylated cytosines to uracils (yellow letters), whilst methylated cytosines are retained as cytosines (white letters). Two rounds of PCR are then performed: the first PCR amplifies each region for each sample separately and adds eight random nucleotides (N8) for data de-duplication and adapter sequences; after pooling amplicons for each biological sample, a second PCR completes a sequence-ready library with sample-barcodes for multiplexing. White lollipops – unmethylated CpGs; black lollipops – methylated CpGs; black DNA strand – targeted strand for amplification; light grey DNA strand – strand not targeted for amplification; Dark grey and green boxes - primers annealing the targeted strand (dark grey), containing adapter sequences (green); green and yellow – primers annealing the adapters (green), containing barcoded Illumina adapters and Illumina PE1.0 primer sequence (yellow).

