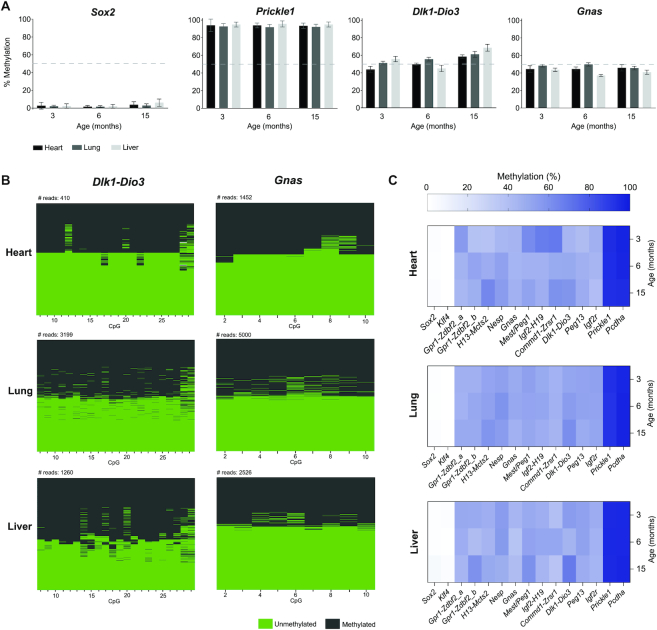
Figure 2.
IMPLICON in adult tissues from C57BL/6J mice. (A) Methylation analysis of Sox2 (unmethylated control), Prickle1 (methylated control), and the Dlk1-Dio3 and Gnas ICRs in heart, lung and liver tissues from adult mice of different ages: 3 months, 6 months and 15 months; Graph represents the mean ± SD methylation levels measured at each CpG within each genomic region for each individual mouse; dashed line marks 50% level of methylation. (B) Plot displaying methylated and unmethylated CpGs for each CpG position (in columns) in all the individual reads (in rows) for both the Dlk1-Dio3 and Gnas (for the Gnas_SNP primer) imprinted loci in the heart, lung and liver of a 3-month-old mouse. (C) Heatmap displaying average methylation levels at individual imprinted regions and controls (in columns) from adult mice of different ages (in rows) in heart, lung and liver.

