Figure 4.
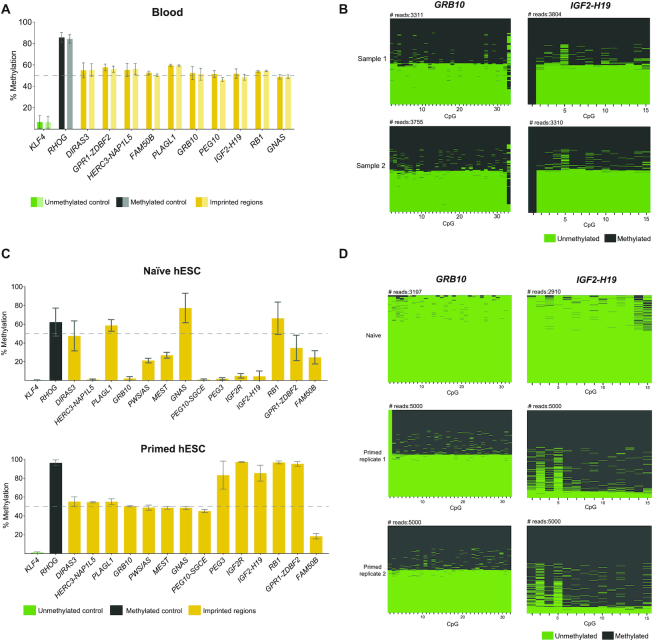
Human IMPLICON in blood, naïve and primed hESCs. (A) Methylation analysis of the KLF4 (unmethylated control), RHOG (methylated control) and several gDMRs in blood samples from two independent individuals; Graph represents the mean ± SD methylation levels measured at each CpG within each genomic region for each individual blood sample (sample 1: dark colours; sample 2: light colours); dashed line marks 50% level of methylation. (B) Plot displaying methylated and unmethylated CpGs for each CpG position (in columns) in all the individual reads (in rows) for GRB10 and IGF2-H19 for each individual blood sample (Sample 1 and 2). (C) Methylation analysis of the unmethylated (KLF4), methylated (RHOG) controls and several gDMRs in naïve and primed hESCs; Graph represents the mean ± SD methylation levels measured at each CpG within each genomic region; primed hESCs shown here are an average of two replicates, whereas for naïve hESCs only one sample was analysed; dashed line marks 50% level of methylation. (D) Plot displaying methylated and unmethylated CpGs for each CpG position (in columns) in all the individual reads (in rows) for GRB10 and IGF2-H19 for individual hESC samples (one naïve and two primed hESC replicates).

