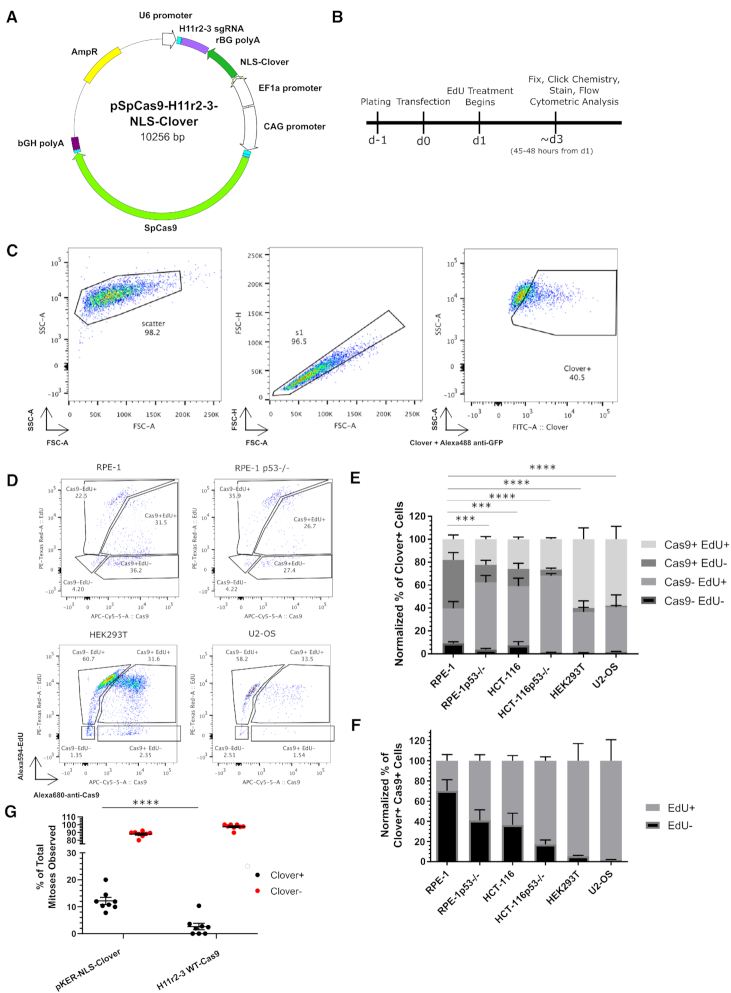
Figure 1.
CRISPR/Cas9 treatment decreases cell cycle progression. (A) Schematic of transfected plasmid, identifying the H11 r2-3 gRNA cassette, the NLS-Clover cassette, and the WT-Cas9 cassette. (B) Experimental design schematic. (C) Flow cytometry gating strategy for identifying the transfected (Clover+) subpopulation. (D) Representative flow cytometric data of transfected cells for Cas9 and EdU positivity for the indicated cell lines. (E) Bar graph of the normalized percentages of four Cas9 EdU subpopulations in transfected cells for the six indicated cell lines. n = at least two independent experiments consisting of three technical replicates for each transfection. Data are shown as the mean ± SEM. Data were analyzed via an ordinary two-way ANOVA followed by a post-hoc Dunnett's multiple comparisons test comparing each cell type to RPE-1 cells. Significance is shown for the [Cas9+ EdU-] subpopulation comparisons. ***P < 0.001, ****P < 0.0001. (F) Bar graph of the Cas9+ normalized percentages of EdU+ and EdU- from panel E. Data is shown as the mean ± SEM. (G) Quantification of observed mitoses during live imaging of transfected and untransfected RPE-1 cells over a roughly two-day period. Each dot represents an individual movie and are from a total of 2 biological replicates. Transfected cells are indicated in black and untransfected cells are indicated in red. Each black dot has a corresponding red dot. Mean ± SEM are indicated by bars. ****P < 0.001. Data were analyzed by a two-way ANOVA followed by Sidak's multiple comparisons test.

