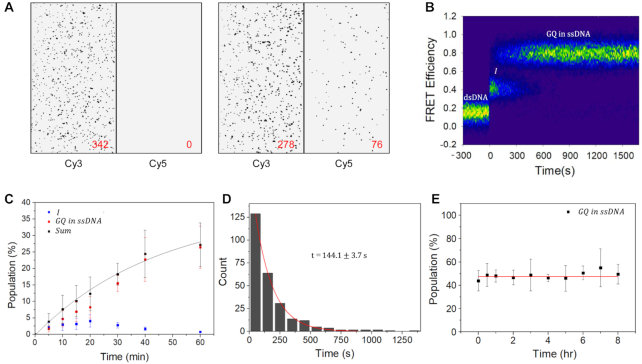
Figure 2.
GQ accumulation under a multiple-round transcription condition. (A) Cy3 and Cy5 images at Cy3 excitation before transcription start (left) and 1 h after transcription start (right). The numbers of spots are presented in the figure. For better contrast of images, data below a threshold were set to zero. (B) A contour plot of FRET efficiency trajectories exhibiting GQ formation. FRET time traces were post-synchronized at first FRET transition events. To correct the photobleaching effect, the decreasing molecule numbers were normalized. (C) Time-dependent change of relative populations of I-state (navy) and GQ state (red) with respect to total FRET pairs after transcription start. The population sum of I-sate and GQ state (black) is fitted to a single-exponential function with a time constant of 45.3 ± 5.6 min (black lines). (D) A dwell time histogram of I-state. The histogram is fitted to a single-exponential function with a time constant of 144.1 ± 3.7 s (red lines). (E) Stability of the cotranscriptionally formed GQ. Time dependence of preformed GQ population was studied by using time-lapse FRET experiments after stopping transcription by washing out RNA polymerase and rNTP. The red line is added as an eye guide. The errors in (C) and (E) are the standard deviation of the mean of more than three independent experiments.

