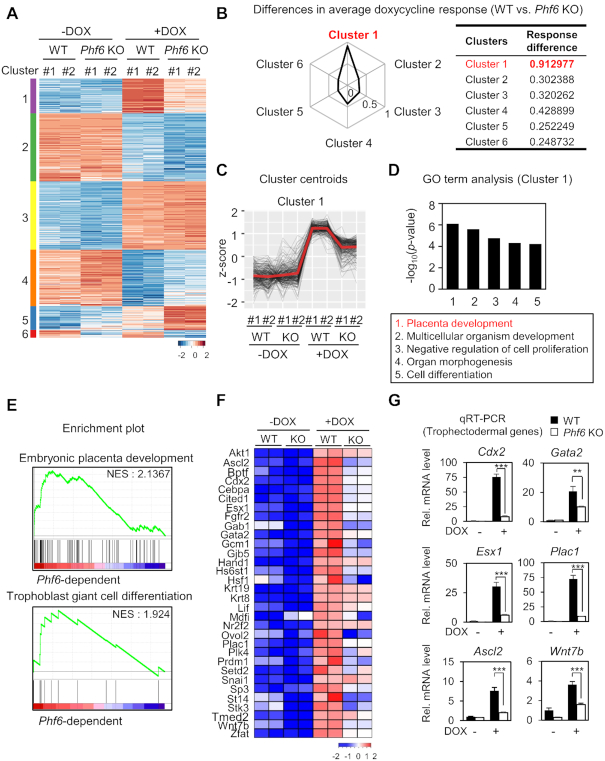
Figure 2.
RNA-seq analysis reveals PHF6 as a transcriptional activator for trophectodermal genes. (A) Heatmap of k-means clustering of variably expressed genes in WT and Pfh6 KO ESCs with or without DOX treatment (n = 1775, k = 6). Genes were grouped into six clusters on the basis of expression similarity. (B) Differences in DOX response for WT and Phf6 KO ESCs. DOX response is calculated using average of z-score differences of genes for DOX treatment in ESCs. (C) z-score centroids of Cluster 1 genes. The center of the cluster is highlighted as red. (D) Functional Gene Ontology (GO) analysis of Cluster 1. Placenta development was the most enriched terms in Cluster 1. (E) Representative gene set enrichment analysis (GSEA) of DEGs. The gene sets involved in embryonic placenta development and trophoblast giant cell differentiation were significantly enriched according to phenotypic labels. The pattern of media gene expression from centroids (D) was used for standards of significance. (F) Trophectodermal genes that were down-regulated in Phf6 KO ESCs in comparison with WT ESCs. The color bar represents the gradient of log2-fold-changes in each comparison. Positively correlated genes from GSEA were selected. (G) qRT-PCR analysis of trophectodermal genes in WT and Phf6 KO ESCs with or without DOX treatment. mRNA levels of each gene were determined as relative values for Gapdh and relatively compared based on WT - DOX. Statistical significance was calculated by ANOVA test (*P < 0.05, **P < 0.01, ***P < 0.001).

