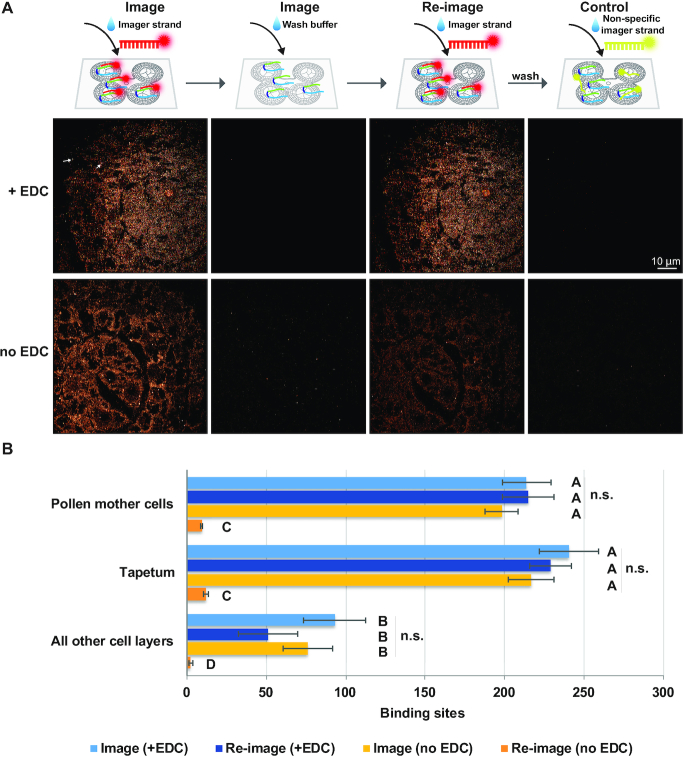
Figure 3.
Comparison of sRNA-PAINT imaging and re-imaging with and without EDC treatment. (A) sRNA-PAINT imaging signal can be re-detected to a similar level when treated with EDC. Without EDC treatment, re-imaged samples have lower fluorescence signal. A non-specific imager strand (last column) was used as a control. Scale bar = 10 μm in all images. We used the same anther section used in Figure 2. Arrows indicate 2 of the of ∼66 fiducials used in experiments. (B) qPAINT analysis of image in panel A. Numbers shows the binding events for each cell in different cell layers. Ten different locations in each specified cell layer were taken for statistical analysis. Error bars indicate standard error for each sample. Letters indicate significant differences using Tukey's test (P < 0.05, n = 50). No significant difference was observed in each cell layer during imaging and re-imaging in EDC treated samples.

