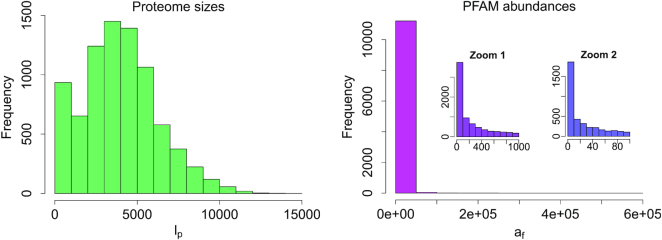
Figure 1.
Proteome sizes and families abundances in PFAM database. On the left panel: frequency histogram of proteome lengths lp (total number of families of which a proteome p is composed). On the right panel: frequency histogram of family abundances, af (number of times a PFAM f appears along a proteome).

