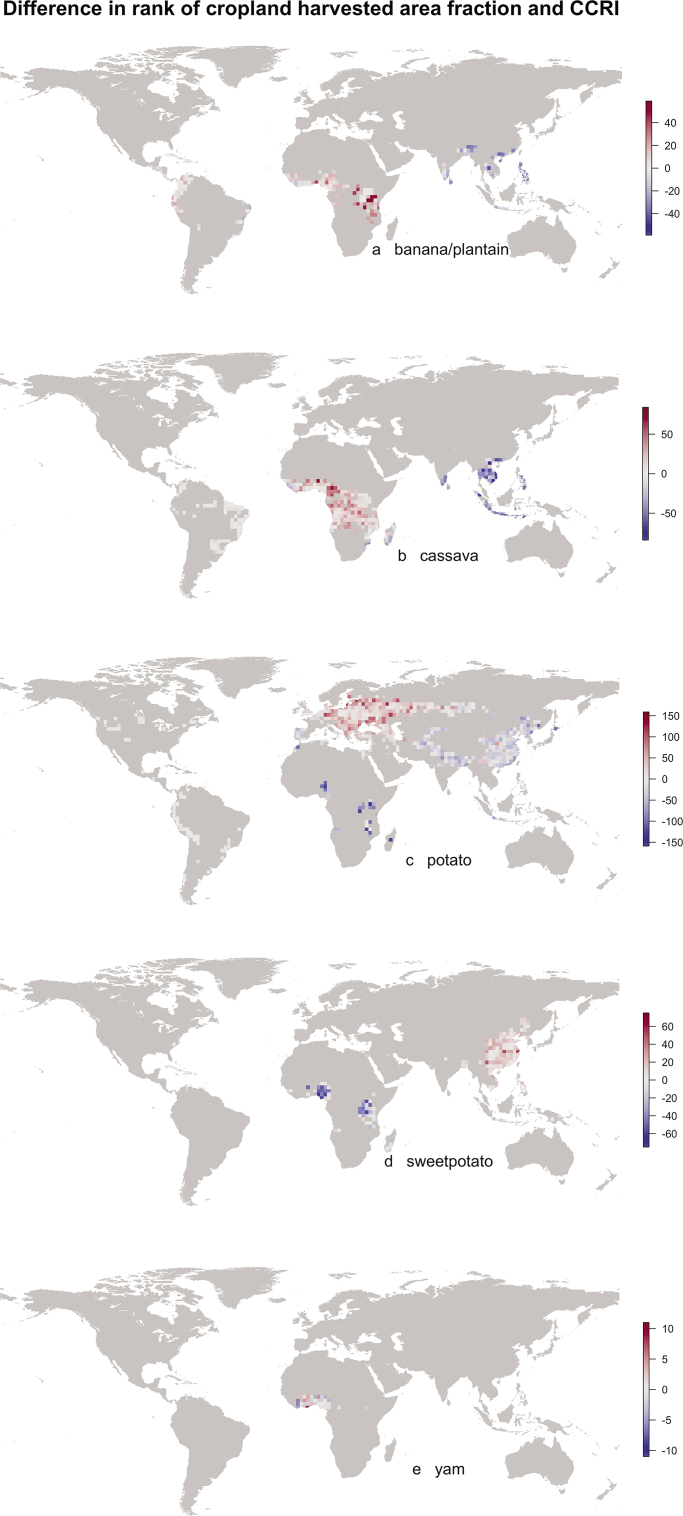
Figure 5.
Maps of the difference in cell rank between harvested area fraction and the mean cropland connectivity risk index for banana and plantain, cassava, potato, sweet potato, and yam (based on the mean of crop density estimates from Monfreda et al. 2008 and SPAM, IFPRI and IIASA 2016). The locations at which the CCRI has substantially higher rank than the crop density could have important roles in spread that would not be identified if analyses were limited to crop density.

