Figure 1.
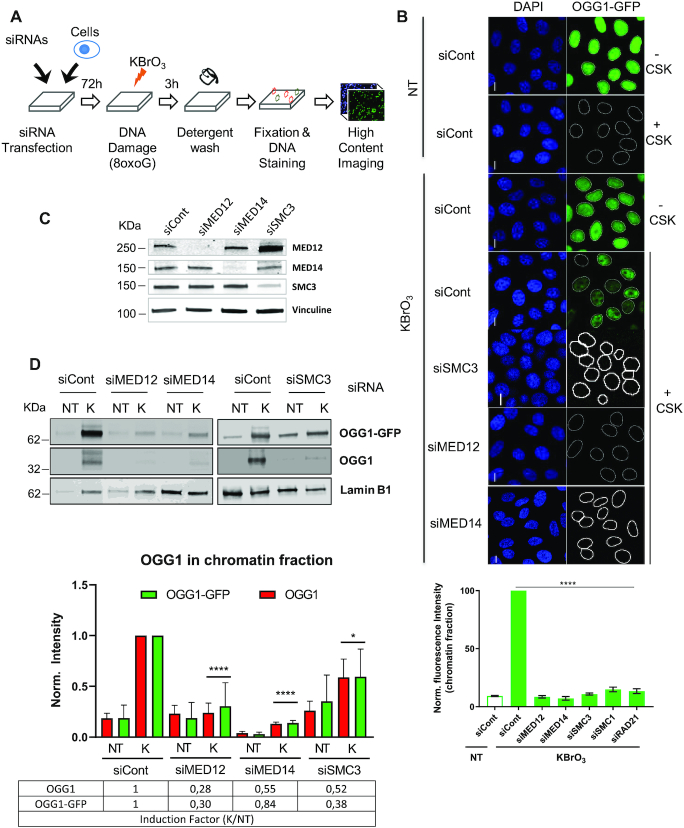
Cohesin and mediator are essential for OGG1’s association with chromatin. (A) Cell-based assay setup for siRNA high-throughput screening (details in the supporting material). (B) Upper panel, HeLa cells stably expressing OGG1–GFP were transfected with the indicated siRNAs and the presence of OGG1–GFP in KBrO3– or non-treated (NT) cells was evaluated before or after removal of the soluble fraction by CSK pre-extraction. Nuclei were stained with DAPI. Scale bar, 5 μm. Lower panel, quantification of the OGG1–GFP on chromatin. At least 1000 cells were analysed after CSK extraction for each siRNA and the experiment was repeated three times. Values obtained in cells transfected with the siRNA control were set to 1 and used for normalization. Error bars represent SEM. Results are expressed as the normalized mean GFP fluorescence ± SEM. Statistical analysis with a Kruskal–Wallis test. (****) P < 0.0001. (C) Protein extracts prepared from cells transfected with siRNAs against MED12, MED14 or SMC3 were analysed by western blot to check for the efficiency of the siRNAs. (D) Effect of depletion of MED12, MED14 and SMC3 on the presence of OGG1–GFP and OGG1 in the chromatin fractions of untreated cells (NT) and cells exposed to KBrO3 (K). Cells were washed with CSK buffer to remove soluble proteins and the levels of chromatin associated OGG1 were evaluated by western blot. Lamin B1 was used as a loading control. The graph represents quantification of at least three independent experiments. Intensity was normalized to the levels measured in the control cells exposed to KBrO3. KBrO3 enrichment of the indicated proteins is represented as a ratio of the levels measured in KBrO3 compared to those in NT cells. Ratios are normalieed to the values obtained in the cells transfected with the siControl set to 1. Error bars represent SD. Statistical analysis was performed with an unpaired t-test for both OGG1 and OGG1–GFP comparing the effect of each siRNA to the siRNA Control. (****) P < 0.0001; (*) P <0.05.

