Figure 2.
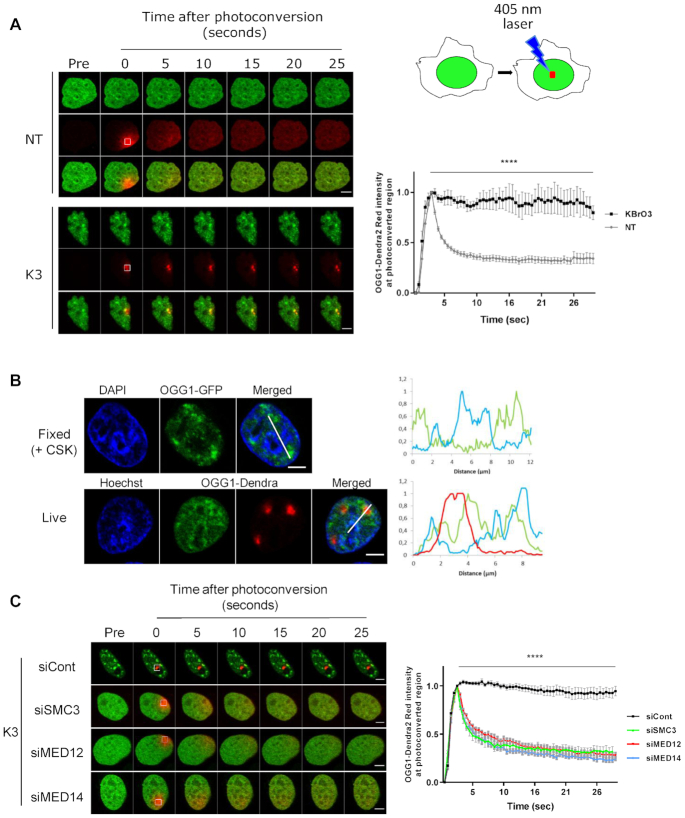
OGG1 immobilization on euchromatin requires cohesin and mediator. (A) OGG1–Dendra2 was photoconverted from green to red using the 405 nm laser and both green and red signals were followed over time. Images obtained before photoconversion or at different times after photoconversion are shown. Red signal was monitored in the photoconverted region in both non-treated cells (NT) and 3 h after exposure to KBrO3 (K3). Graph shows quantification of the red fluorescence in 10 cells from two independent experiments. Statistical analysis was performed using multiple t-test (****) P < 0.0001. (B) HeLa cells expressing OGG1–GFP or OGG1–Dendra2 were exposed to KBrO3 and protein localization evaluated after CSK pre-extraction or photoconversion respectively. DNA (blue) is labeled with DAPI in fixed cells or Hoechst 33345 in living cells and used as an indicator of chromatin compaction. For the OGG1–Dendra2 experiment Hoechst 33345 was added after photoconversion. Plot profiles show the retention of OGG1 in regions showing a weak DAPI/Hoechst staining corresponding to euchromatin domains. (C) Protein dynamics of photoconvertible OGG1–Dendra2 in cells depleted for SMC3, MED12 or MED14 3 h after KBrO3 treatment (K3). Graph shows quantification of red fluorescence in 10 cells for each siRNA from a representative experiment. The experiment was repeated three times. Statistical analysis was performed using multiple t-test (****) P < 0.0001. Scale bars: 5 μm.

