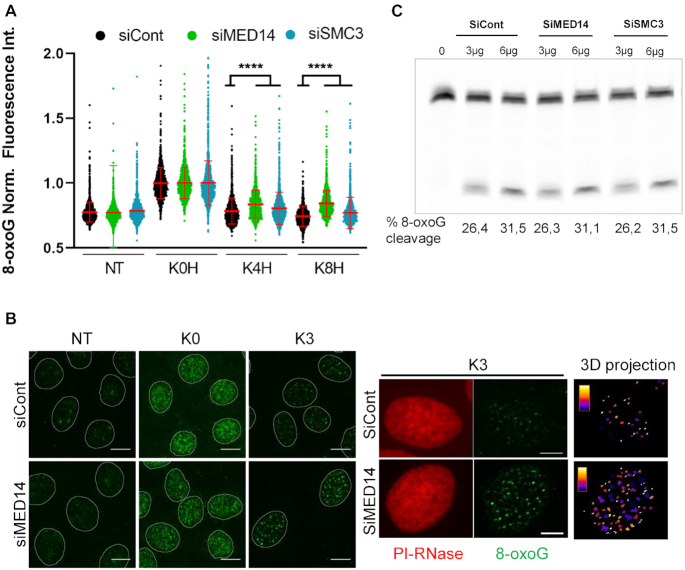
Figure 3.
8-oxoG excision is impaired in the absence of mediator or cohesin. (A) Relative 8-oxoG levels were determined by immunofluorescence using an antibody against the lesion before and at different times after exposure to KBrO3 in control cells or cells depleted for SMC3 or MED14. NT = non-treated, K0H, K4H and K8H = immediately, 4 and 8 h after treatment, respectively. More than 1000 cells were analysed for each of the conditions and presented results correspond to a representative experiment out of three independent ones. The mean of 8-oxoG measured immediately after exposure to KBrO3 (K0H) for each siRNA was set to 1 and used for normalization. Statistical analysis used a Kruskal–Wallis test. (****) P < 0.0001. (B) Representative images of 8-oxoG (green) detected by immunofluorescence in non-treated (NT) and KBrO3 treated cells, at 0 (K0) or 3 (K3) hours after the treatment in control cells or cells depleted in MED14. A maximal projection of a z-stack (49 slices every 150 nm) is shown. The mask of the nucleus obtained using propidium iodide (PI) staining is shown. Higher magnifications for PI and 8-oxoG are shown in the right panels. A 3D projection of the 8oxoG foci through the entire nuclear volume is shown. The color scale illustrates the volume of the foci from smaller (white) to bigger (blue). Scale bar: 10 μm. (C) OGG1 activity in total cell extracts from cells depleted for MED14 or SMC3 compared to control cells. Cleavage of an 8oxoG-containing oligonucleotide by increasing amount of protein total extracts.

