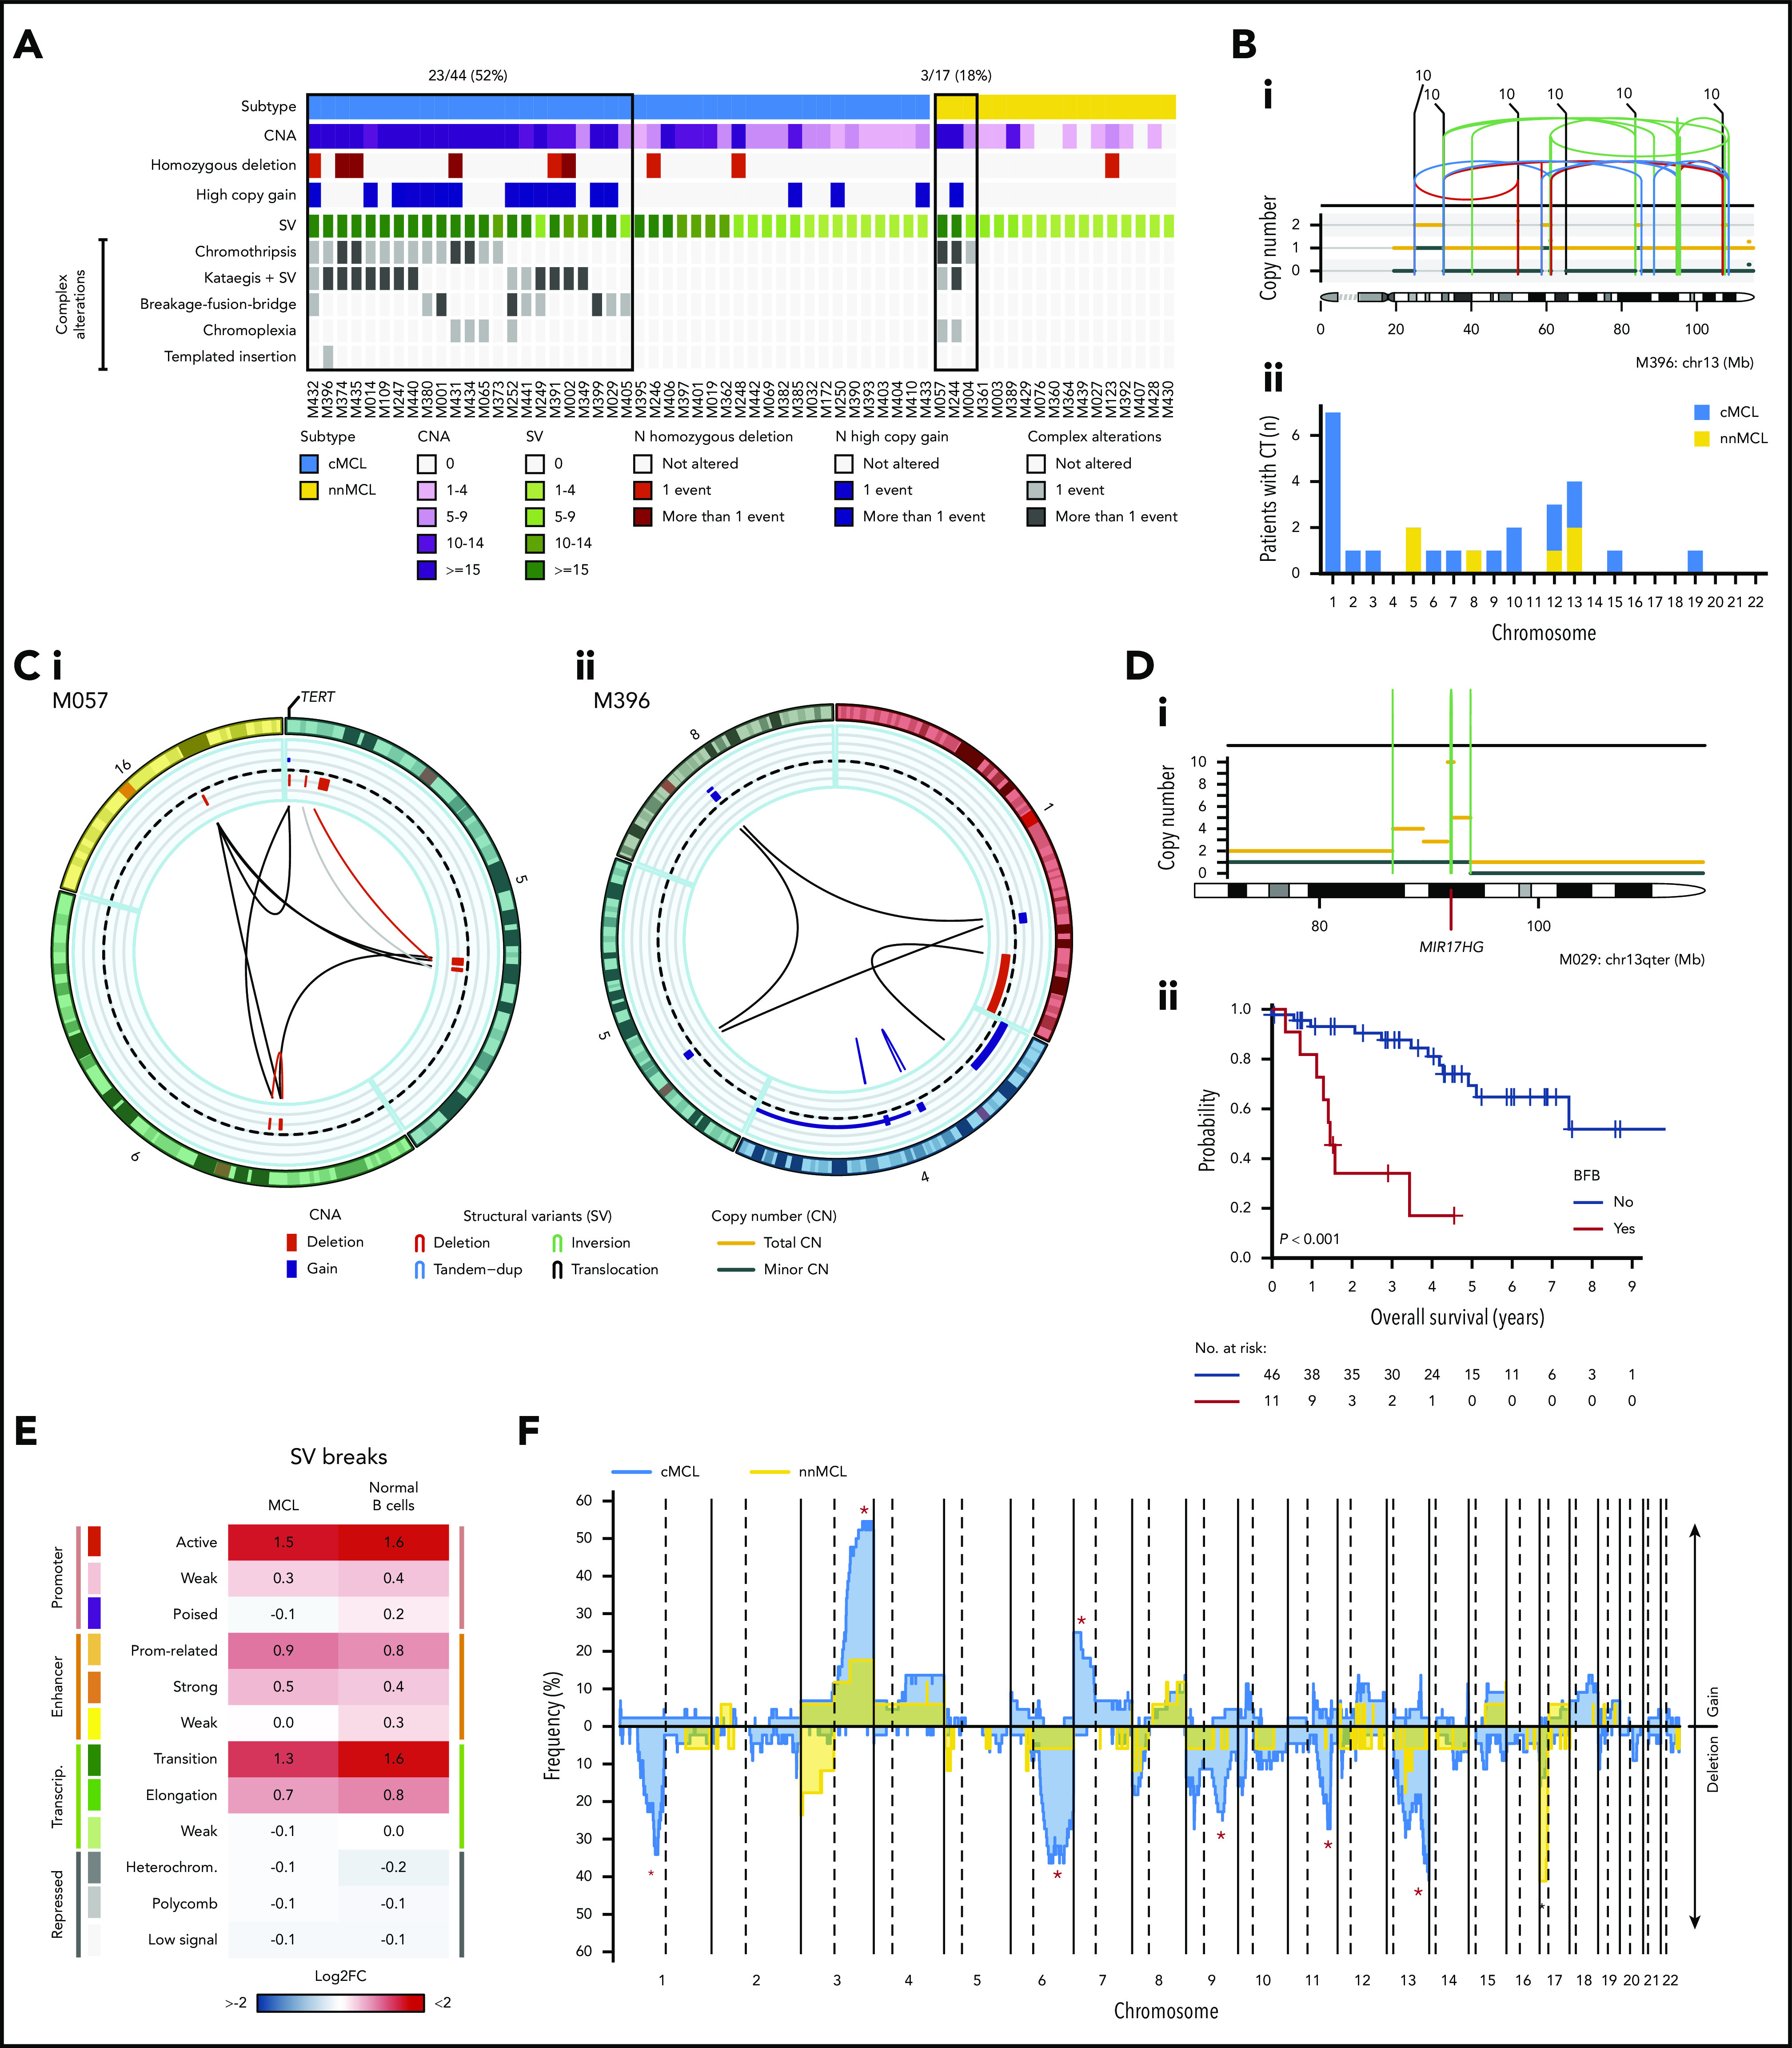
Figure 3.

Complex genomic alterations in MCL identified by WGS. (A) Genomic complexity identified in both subtypes of MCL. Cases are depicted in columns. Rows illustrate CNA complexity, the number of homozygous deletions and amplifications, SV complexity, and different SV complex phenomena characterized by clustered SV (chromothripsis, kataegis overlapping with SV, BFB cycles, chromoplexia, and templated insertions). (B) Illustrative example of a whole chr13 affected by chromothripsis in a cMCL (i). (ii) Bar plot of chromosomes affected by chromothripsis (CT) in the 2 MCL subtypes. (C) Partial circos plot showing the 3 chromosomes involved in chromoplexia and TERT amplification and translocation in a nnMCL (i). (ii) Partial circos plot showing 4 chromosomes with crossed rearrangements and template insertions (focal gains) in 3 of them (chromosomes 1, 5, and 8) in a cMCL. (D) Illustrative example of BFB cycles resulting in amplification of MIR17HG in 13q accompanied by a terminal deletion (i). (ii) Kaplan-Meier curve of OS according to the presence of BFB cycles. (E) Enrichment of SV breakpoints in different chromatin states, as compared with background, in MCL and normal B cells. (F) Global profile of CNA in cMCL (blue) and nnMCL (yellow). The regions with different proportions of altered cases between subtypes (Q < 0.15) are indicated (*). Only regions with at least 6 altered cases were included in the comparison.
