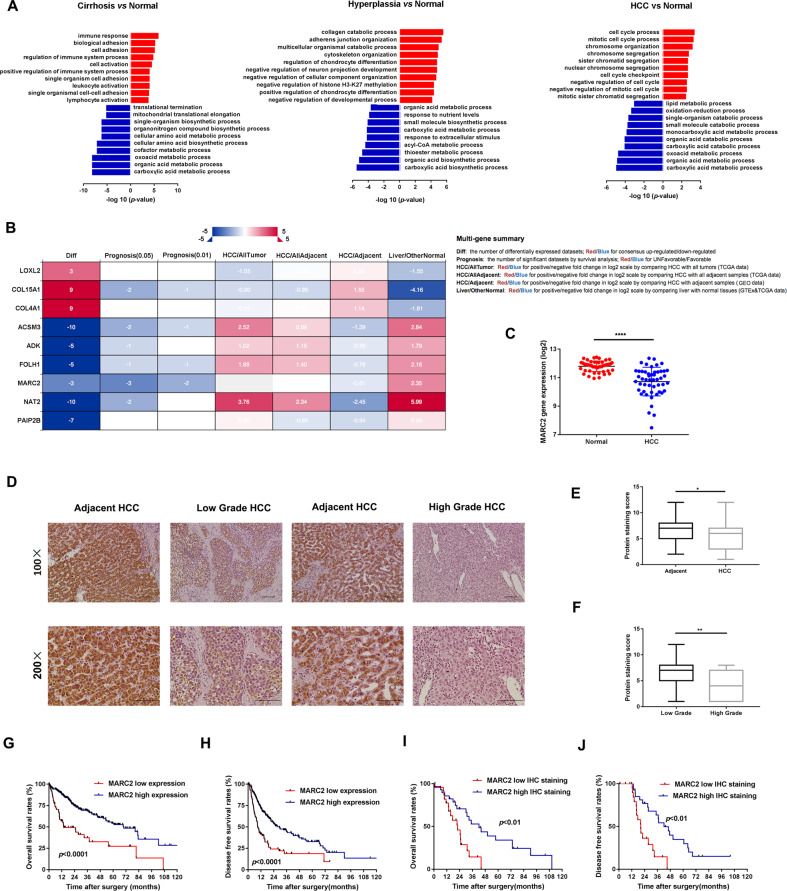
Fig. 1. MARC2 is downregulated in HCC and predicted poor prognosis.
a Gene expression data were extracted from GSE3500, GSE6764, and GSE14520. Different expression gene existed in all the three databases were filtered and separated into two groups (upregulated group: red and downregulated group: blue) enriching in cell process. b Filtered genes were valid in different databases in the left panel; the annotation for column in the datasheet in the right panel. The survival analysis of MARC2 was significant in three datasets (prognosis p < 0.05), and more significant in two datasets (prognosis p < 0.01). c MARC2 mRNA levels were significantly decreased in HCC tissues (n = 50) compared with the paired adjacent normal tissues (n = 50). d Representative images of MARC2 IHC staining in human HCC tissues and adjacent normal liver tissues. Bar = 100 µm (*100); Bar = 50 µm (*200). e IHC staining score was used to compare the protein expression of MARC2 between HCC tissues (n = 57) and the adjacent normal tissues (n = 82). f IHC staining score was used to compare the protein expression of MARC2 between patient with low tumor grade (n = 36) and patient with high tumor grade (n = 19). g, h The Kaplan–Meier method was used to compare the OS and DFS between the patient group with high level of MARC2 and patient group with low level of MARC2. i, j The Kaplan–Meier plots of OS and DFS between patients with high (n = 15) and low level of MARC2 (n = 15) according to IHC scores. The log-rank test was used to compare survival between different groups. *p < 0.05; **p < 0.01; ***p < 0.001, all of which were considered statistically significant.

