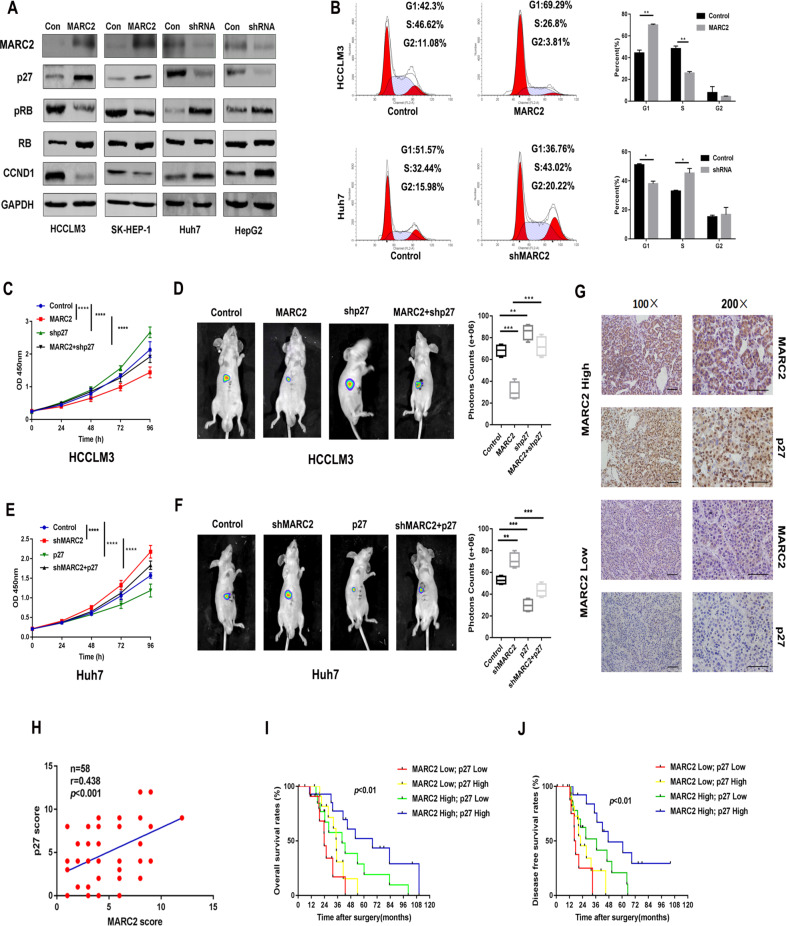
Fig. 3. MARC2 suppresses the progression of HCC via regulating the protein expression of p27.
a Expression of MARC2 and cell cycle associated signal proteins in the indicated cell lines was measured by western blot. b Representative images of cell cycle phase in the indicated cell lines in the left panel and statistical analysis in the right panel. c, e The growth curves of the indicated cell lines representing the proliferation rates were measured by CCK8 assay. d, f Representative images of liver xenograft derived from indicated cell lines in the left panel and the statistical analysis of bioluminescence signal in the right panel. c, d HCCLM3 cell line was used for the cell and mice experiment. e, f Huh7 cell line was used for the cell and mice experiment. g IHC staining of MARC2 and p27 in human HCC tissues. Bar = 100 µm (*100); Bar = 50 µm (*200). h IHC scores were used to exam correlation of protein expression between p27 and MARC2. The Pearson correlation coefficient was used to determine the correlation. i, j The Kaplan–Meier method was used to determine the overall survival and disease free survival of patient with HCC; the log-rank test was used to compare survival between different groups. *p < 0.05; **p < 0.01; ***p < 0.001, all of which were considered statistically significant.

