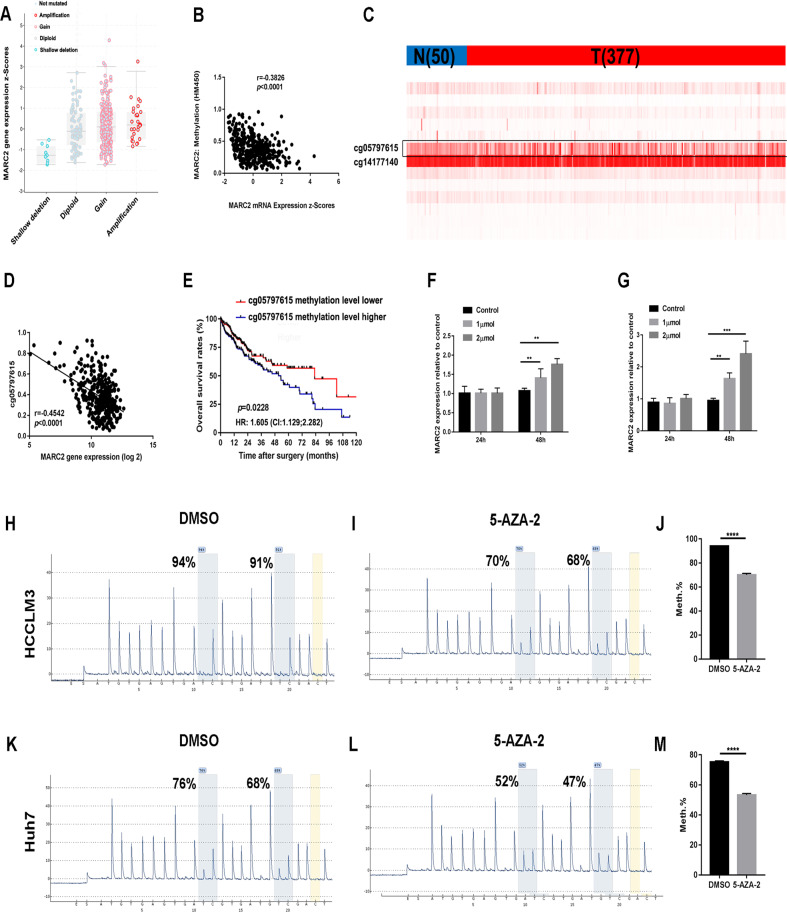
Fig. 7. MARC2 is downregulated by methylation.
a Gene expression of MARC2 in different copy number groups. Shallow deletion: 0.5; Diploid: 1; Gain: 1.5; Amplification: 2. b Correlation between MARC2 gene expression and methylation score of MARC2. The Pearson correlation coefficient was used to determine the relationship. c Heatmap for the CpG sites of MARC2. N represented the normal tissue (n = 50), and T represented the tumor tissue (n = 377). d Correlation between MARC2 gene expression and methylation score of cg05797615. The Pearson correlation coefficient was used to determine the relationship. e The Kaplan–Meier method was used to compare the OS between the patient group with high methylation score of cg05797615 and patient group with low methylation score of cg05797615. f, g 0, 1, 2 µmol 5-Aza-2′-deoxycytidine was added to HCCLM3 and Huh7 cell lines respectively. qPCR was used to analyze the gene expression of MARC2 in HCCLM3 and Huh7 cell lines treated with 5-Aza-2′-deoxycytidine at 24 h and 48 h. h–m Pyrosequencing was used to analyze the methylation level of cg05797615 in HCCLM3 and Huh7 cell lines treated with 5-Aza-2′-deoxycytidine in the left panel and statistical analysis in the right panel. *p < 0.05; **p < 0.01; ***p < 0.001.

