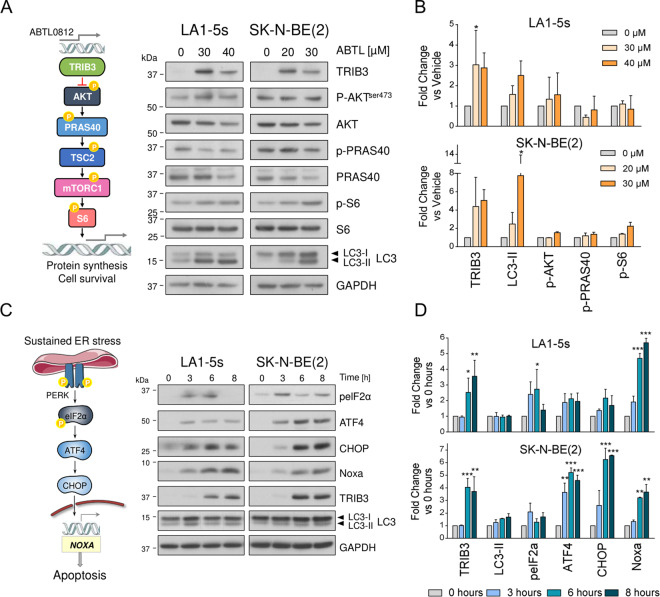
Fig. 3. ABTL0812 triggers the UPR-PERK signalling pathway.
a Left, representative scheme of the AKT/mTORC1 pathway. Right, western blot of the components of the pathway in LA1-5s and SK-N-BE(2) cell lines treated with the indicated ABTL0812 concentrations for 24 h. b Western blot quantification. Graph represents the mean of two out of three independent experiments. Band intensity was normalised to GAPDH and vehicle-treated cells. *p ≤ 0.05, compared to vehicle. c Left, representative scheme of the UPR PERK pathway. Right, western blot of the components of the pathway in LA1-5s and SK-N-BE(2) cell lines treated with the indicated ABTL0812 concentrations for 0, 3, 6 and 8 h. d Graph represents the mean quantification of two out of three independent experiments. Band intensity was normalised to GAPDH and time 0 h. *p ≤ 0.05, **p ≤ 0.01, ***p ≤ 0.001 compared to time = 0.

