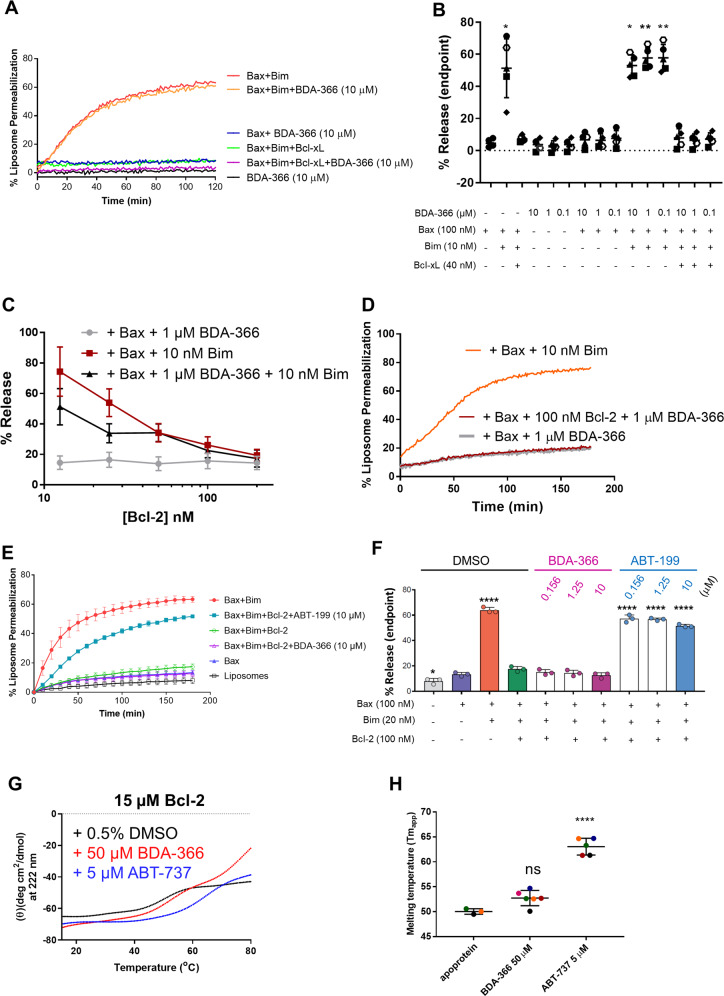
Fig. 4. BDA-366 does neither directly activate Bax nor indirectly via Bcl-2.
a Representative plot of the liposome permeabilisation assay with BDA-366 and different Bcl-2-family members. Liposomes (0.04 mg/mL) encapsulating ANTS and DPX were incubated with BDA-366 (0.1–10 µM), Bim (10 nM) and Bax (100 nM) in the presence or absence of Bcl-xL (40 nM). Liposomes incubated with Bax (100 nM) and Bim (10 nM) were used as positive control, while DMSO (1%) served as the vehicle control. Fluorescent intensity of ANTS (excitation = 355 nm and emission = 520 nm) was measured during 120 min, whereas Bax (100 nM) was added at t0. b Results obtained from endpoint measurements are presented as mean ± SD of five independent experiments. Significance, compared to control condition with only Bax, was determined using a one-way Anova with post hoc Dunn’s multiple comparisons test. c Analysis of permeabilisation of liposomes incubated with 10 nM Bim and 100 nM Bax and increasing concentrations of Bcl-2 (N = 3). d Representative plot of the liposome permeabilisation assay with BDA-366 and Bcl-2. Liposomes encapsulating ANTS and DPX and were incubated with 1 µM BDA-366; 100 nM of Bcl-2 and Bax (100 nM). Fluorescent intensity of ANTS (excitation = 355 nm and emission = 520 nm) was measured during 120 min. Liposomes incubated with Bax (100 nM) and Bim (10 nM) were used as positive control. e Similar experiment as in Panel A using varying concentration of BDA-366 or ABT-199 (ranging from 0 to 10 μM), Bcl-2ΔTMD (100 nM), Bax (100 nM), and Bim (20 nM). Data are presented as averages ± SD of three independent experiments at 10 min intervals for 180 min. f Results obtained from endpoint measurements are presented as mean ± SD of three independent experiments. Significance, compared to control condition with only Bax, was determined using a one-way Anova with post hoc Dunnett’s multiple comparisons test. g Thermal denaturation curves of Bcl-2 (15–85 °C) were obtained by monitoring ellipticity at 222 nm, by far-UV CD, while heating the protein samples [15 µM; 250 µL; 5 mM MOPS, pH: 7.5; 5 mM NaCl; 0.5% DMSO; BDA-366 (50 µM) or ABT-737 (5 µM) as indicated] at 1 °C/min. A representative experiment is shown. h Quantitative analysis of Tmapp of purified Bcl-2, in the presence or not of drugs (as indicated), obtained from experiments similar to those presented in (g). Data presented here are averages ± SD of independent experiments (N > 3). Statistical significance was determined with a one-way ANOVA with a Tukey’s multiple comparisons test comparing apoprotein with BDA-366 or ABT-737.

