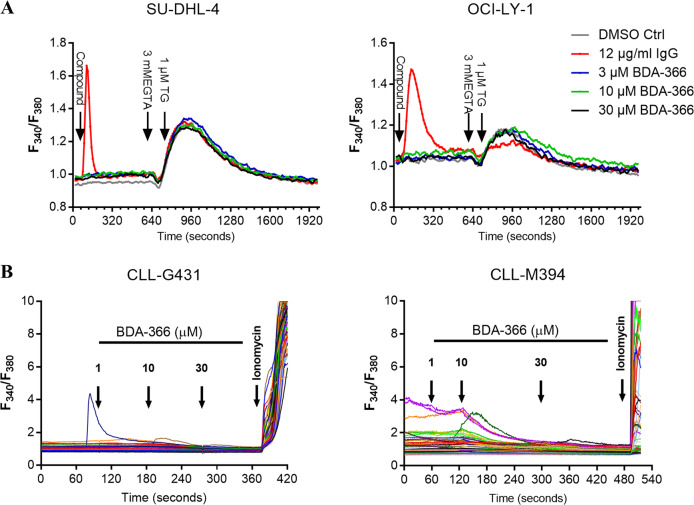
Fig. 5. Acute addition of BDA-366 does not increase intracellular calcium concentration.
a Cytosolic Ca2+ measurement in Fura-2 AM loaded SU-DHL-4 (left) and OCI-LY-1 (right) cells. The compound was added after 60 s (DMSO as control, BDA-366 or IgG/IgM) at the indicated concentrations. Each curve represents the F340/F380 ratio as function of time for cell populations from three separate wells, which were considered as technical replicates. One representative experiment (out of six or four independent experiments, presented in Supplementary Fig. 5) is shown in panel (a). b Single cells cytosolic Ca2+ measurement in Fura-2 AM loaded primary CLL samples. Each curve represents the F340/F380 ratio as a function of time for an individual cell. In each experiment, at least 20 cells were measured. One representative experiment (out of three independent experiments) is shown in panel (b). Data are representative of three independent measurements per patient sample (CLL-G431 and CLL-M394).

