Fig. 2.
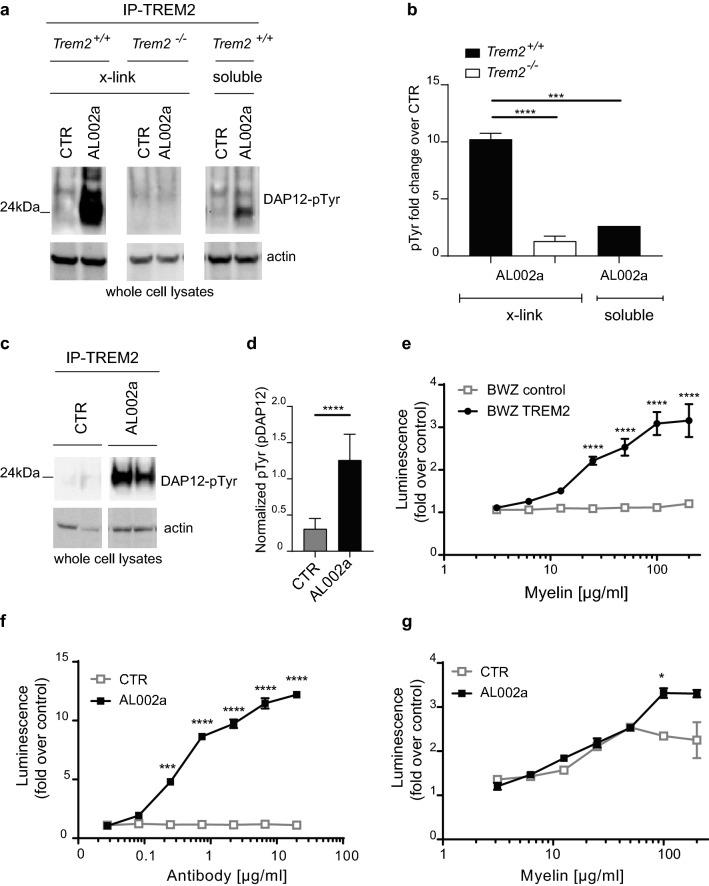
In vitro and in vivo effects of a TREM2-specific antibody on TREM2 signaling. a WB analysis of Trem2+/+ or Trem2−/− BMDM stimulated with a TREM2-specific antibody (AL002a) or with a control antibody, by cross-linking with a secondary antibody (x-link) or in solution (soluble; for Trem2+/+ only). Cells were immunoprecipitated with a rat anti-h/m-TREM2 antibody and fractionated by SDS-PAGE in non-reducing conditions. Phopho DAP12 (pTyr) is shown here as a dimer. b Quantification of DAP12-pTyr normalized on actin is shown as fold change over control. ***P < 0.001, ****P < 0.0001, One-way ANOVA with Tukey’s post hoc test. c Peritoneal cells isolated from Trem2+/+ mice after thyoglicollate treatment, immunoprecipitated with an anti-TREM2 antibody (clone 237920), and analyzed by WB. d Quantification of DAP12- pTyr normalized on actin. ****P < 0.0001, two-tailed unpaired Student’s t test. e Activation of TREM2 signaling in the BWZ reporter cell assay with different concentrations of plate-bound myelin. BWZ cells express either NFAT:luciferase alone (BWZ control) or in combination with mouse TREM2 and DAP12 (BWZ TREM2). ****P < 0.0001, Two-way ANOVA with Sidak’s post hoc test. f TREM2 signaling in the BWZ Trem2 reporter cell assay at different concentrations of AL002a antibody. ***P < 0.001, ****P < 0.0001, Two-way ANOVA with Dunnett’s post hoc test. g Myelin-induced signaling by AL002a (10 µg/ml) in the BWZ Trem2 reporter cell assay at different concentrations of plate-bound myelin. *P < 0.05, Two-way ANOVA with Dunnett’s post hoc test. CTR control

