Fig. 7.
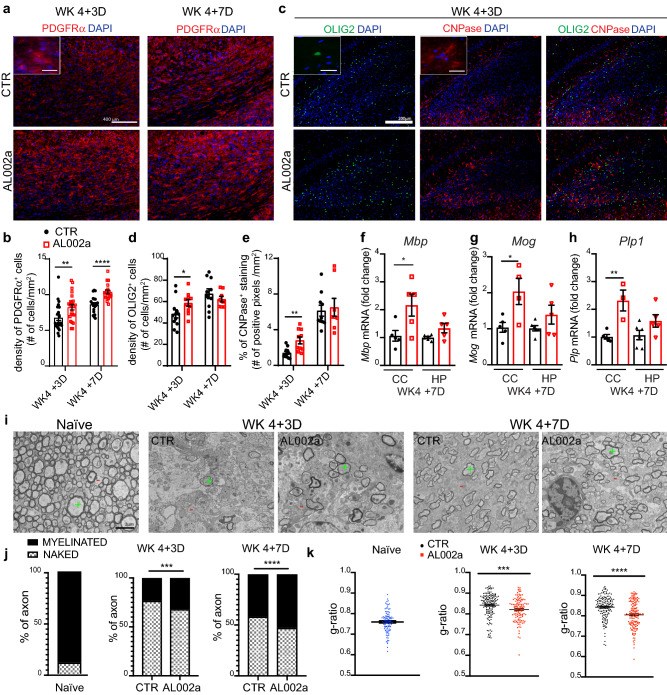
AL002a -treated mice show increased OPC density, mature myelin and remyelination after CPZ-induced demyelination. a Representative images of PDGFRα+ (red) and DAPI (blue) in the CC at WK 4 + 3D and WK 4 + 7D. Original magnification, × 20. Scale bar, 400 µm. Insert magnification, × 60. Scale bar, 25 µm. b Quantification of PDGFRα+ cell density. CTR group: WK 4 + 3D N = 6 mice, n = 24 fields; WK 4 + 7D N = 5, n = 20; AL002a-treated group: WK 4 + 3D N = 6, n = 24; WK 4 + 7D N = 5, n = 20; **P ≤ 0.01; ****P ≤ 0.0001; WK 4 + 3D two-tailed Mann–Whitney test; WK 4 + 7D two-tailed unpaired Student’s t test. c Representative images of OLIG2 (green), CNPase (red) and DAPI (blue) in the CC at WK 4 + 3Ds and WK 4 + 7D. Original magnification, × 10. Scale bar, 200 µm. Insert magnification, × 60. Scale bar, 25 µm. d Quantification of the density of OLIG2+ cells at both the time points. e Quantification of the percentage of CNPase+ staining in the CC. CTR group: WK 4 + 3D N = 6, n = 12; WK 4 + 7D N = 5, n = 10; AL002a-treated group: WK 4 + 3D N = 5, n = 10; WK 4 + 7D N = 4, n = 8; *P < 0.05, **P ≤ 0.01; two-tailed unpaired Student’s t test. RT-qPCR quantification of mRNA levels of myelin basic protein (Mbp) (f), myelin oligodendrocyte glycoprotein (Mog) (g) and proteolipid protein 1 (Plp1) (h) in the corpus callosum (CC) and the hippocampus (HP) of Trem2+/− mice treated with AL002a antibody or CTR. Tissues were collected at WK 4 + 7D. CTR group: N = 5, AL002a-treated group: N = 5 (Mpb); N = 4 (Mog); N = 3 (Plp1). *P < 0.05, two-tailed unpaired Student’s t test. i Electron microscopy (EM) of a naïve mouse and mice treated with AL002a or isotype control antibody at WK 4 + 3D and WK 4 + 7D. Green plus sign indicates myelinated axons and red minus sign indicates naked axons. Original image = × 5000. Scale bar = 2 µm. j Percentage of myelinated axons (MA) and naked axons (NA) in naïve mice, and in CTR and AL200a-treated mice at WK 4 +3D and WK 4 + 7D. ***P < 0.001 at WK 4 + 3D and ****P < 0.0001 at WK 4 + 7D, two-tailed Mann–Whitney test. k G-ratio of myelinated fibers in naïve mice, and in CTR and AL002a-treated mice at WK 4 + 3D and WK 4 + 7D. Each dot represents one axon. Naïve mice N = 2, CTR treated mice at WK 4 + 3D N = 5 and at WK 4 + 7D N = 5; AL002a-treated mice at WK 4 + 3D N = 4 and at WK 4 + 7D N = 5. ***P < 0.001 at WK 4 + 3D and ****P < 0.0001 at WK 4 + 7D, two-tailed unpaired Student’s t test

