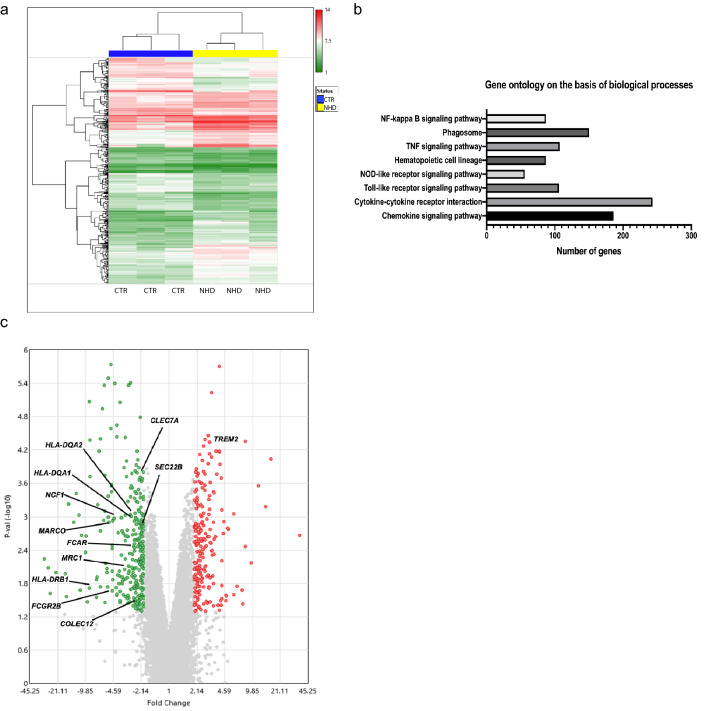
Fig. 9.
Phagocytic pathways dysregulation in macrophages derived from individuals affected by Nasu–Hakola disease. a Heat map showing different expression patterns of genes in Nasu–Hakola (NHD) patients and healthy controls (CTR). The heat map indicates up-regulation (red) and down-regulation (green). b Gene ontology analysis of the differentially expressed genes in NHD patients. c Volcano plots showing the distribution of gene expression fold changes in genes of the phagosome pathway. Genes with fold change > 2 and P value < 0.05 are indicated in red, and genes with fold change < − 2 and P value < 0.05 are indicated in green

