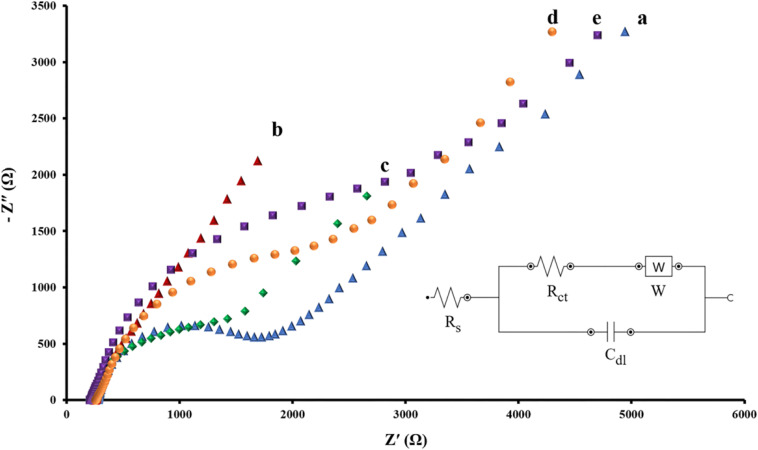
FIGURE 3.
Nyquist spectra of EIS data for intact SPCE (A), AuNPs/SPCE (B), aptamer/AuNPs/SPCE (C), MCH/aptamer/AuNPs/SPCE (D) and BPA (100 pM)/MCH/aptamer/AuNPs/SPCE (E) in 0.1 M PBS (pH 7.4) containing [Fe(CN)6]3–/4–/KCl (5 mM/0.1 M) electrolyte solution. The Randles equivalent circuit was employed to model the electrochemical impedance data, (Rs: solution resistance; Cdl: double layer capacitance; Rct: charge transfer resistance, W: Warburg impedance).

