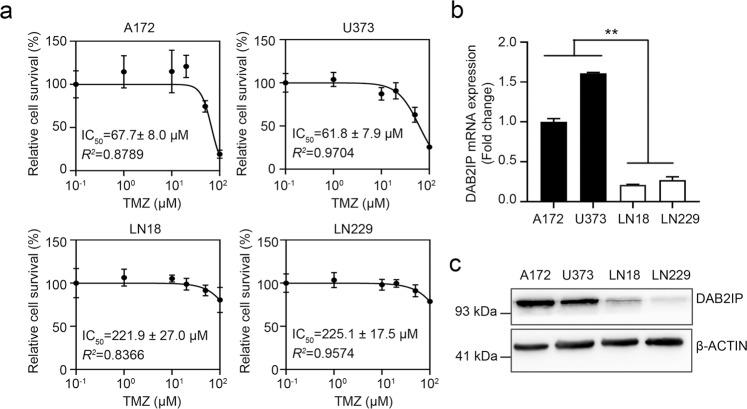
Fig. 1. TMZ-resistant GBM cell lines express a low level of DAB2IP.
a TMZ log–dose–response analysis (IC50) in four human glioblastoma cell lines. Cells were treated with increment doses of TMZ as indicated for 48h, and IC50 was determined with cytotoxicity results assessed by MTT assay. Percent survival curves after TMZ treatment was constructed by plotting the cell survival whose values indicate mean ± SD (n = 5). Error bars indicate standard deviation. b The mRNA expression of DAB2IP analyzed by real-time PCR in four human glioblastoma cell lines. Black and white bars indicate DAB2IP-high and DAB2IP-low cell lines, respectively. Means ± SD; n = 3; Student’s two-tailed t-test, **p < 0.01. c Representative images of western blot against DAB2IP and β-actin.

