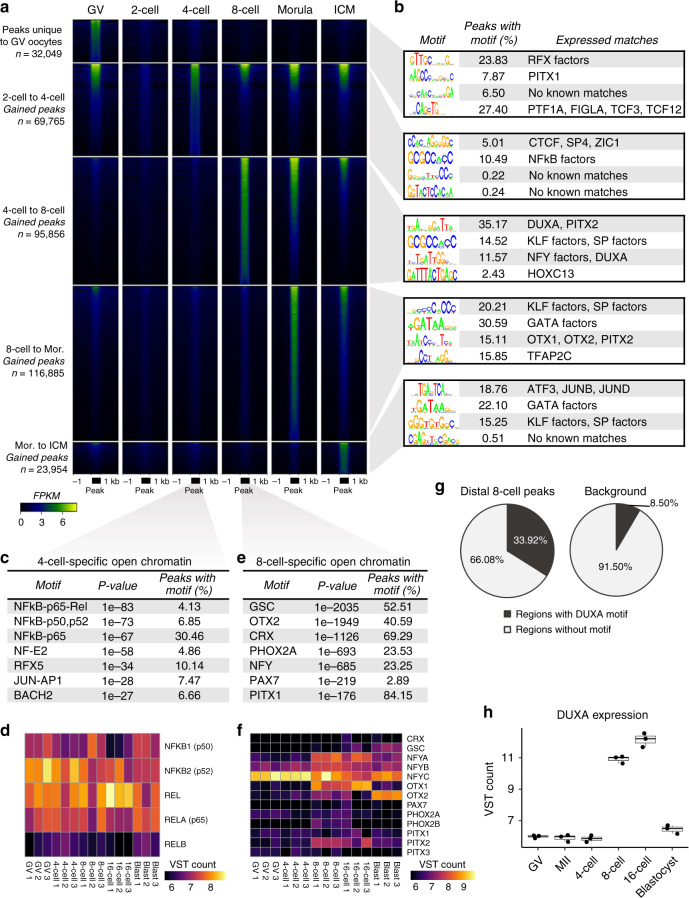
Fig. 2. Gradual establishment of open chromatin enriched in regulatory motifs.
a Normalized ATAC-seq signal (FPKM) shown at peaks that were either unique to GV oocytes, or which were gained between consecutive developmental stages. Peaks at each stage were called from 30 million reads, and were scaled to 500 bp. b Top four de novo motifs enriched in intergenic peaks, matched to known motifs (log odds match score >0.6) of TFs that were expressed at the given stage. c Top seven known motifs enriched in 4-cell specific peaks. Binomial test p values reported. Adjustment for false discovery rate (FDR) yielded Q values less than 1e–4. d Variance stabilized transformed (VST) expression counts of TFs corresponding to enriched motifs in 4-cell specific open chromatin. e Top seven known motifs enriched in 8-cell specific peaks. Binomial test p values reported (all FDR adjusted Q values <1e–4). f VST expression counts of TFs corresponding to enriched motifs in 8-cell specific open chromatin. g Proportion of intergenic 8-cell peaks overlapping the de novo motif most closely matching the DUXA motif, relative to background. h VST expression counts of DUXA throughout development (n = 3 biologically independent samples). Boxplots indicate the median and interquartile range (IQR), and whiskers span 1.5 times the IQR. RNA-seq data from Graf et al.32. Source data are provided as a Source Data file.

