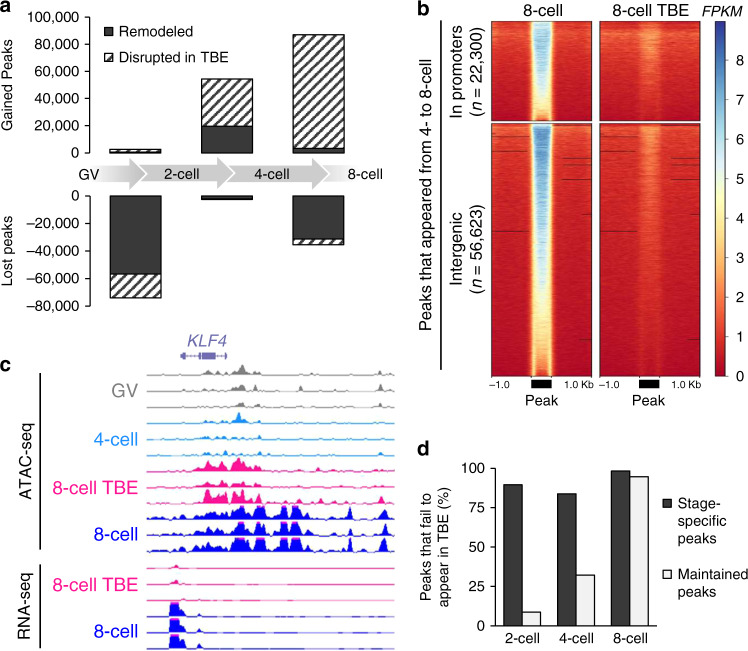
Fig. 4. Effect of transcription inhibition on chromatin remodeling.
a Transcription inhibition effect on loci that should have opened or closed between consecutive stages. Peaks called from 20 million reads per stage. b Normalized ATAC-seq signal (FPKM) in control and transcription inhibited 8-cell embryos at peaks which were gained between the 4- and 8-cell stage. Peaks scaled to 500 bp. c Normalized ATAC-seq (FPKM) and RNA-seq signal (reads per kilobase million; RPKM) in 8-cell control and TBE at the KLF4 locus. RNA-seq data from Bogliotti et al.23. d Proportion of stage-specific and maintained peaks that should appear at each stage, but which fail to appear in TBE. Source data are provided as a Source Data file.

