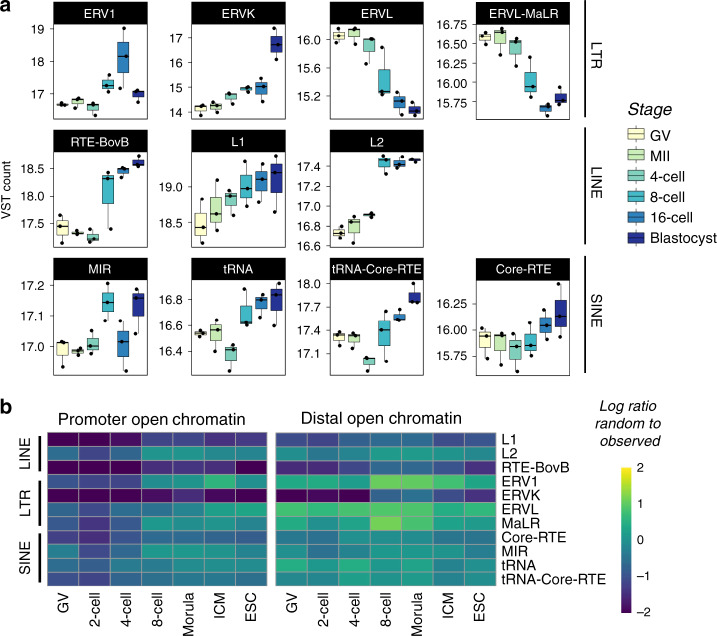
Fig. 6. Expression and accessibility dynamics of repeat families during bovine preimplantation development.
Boxplots indicate the median and interquartile range (IQR), and whiskers span 1.5 times the IQR. a VST normalized expression profiles of select LTR, LINE, and SINE repeat families. RNA-seq data from Graf et al.32. b Enrichment of several transposable element (TE) families in ATAC-seq peaks, called from 30 million reads. Promoter peaks fell within the 2 kb region upstream of TSS. Intergenic peaks did not overlap the 2 kb regions upstream of TSS, exons, or introns (n = 3 biologically independent samples). Source data are provided as a Source Data file.

