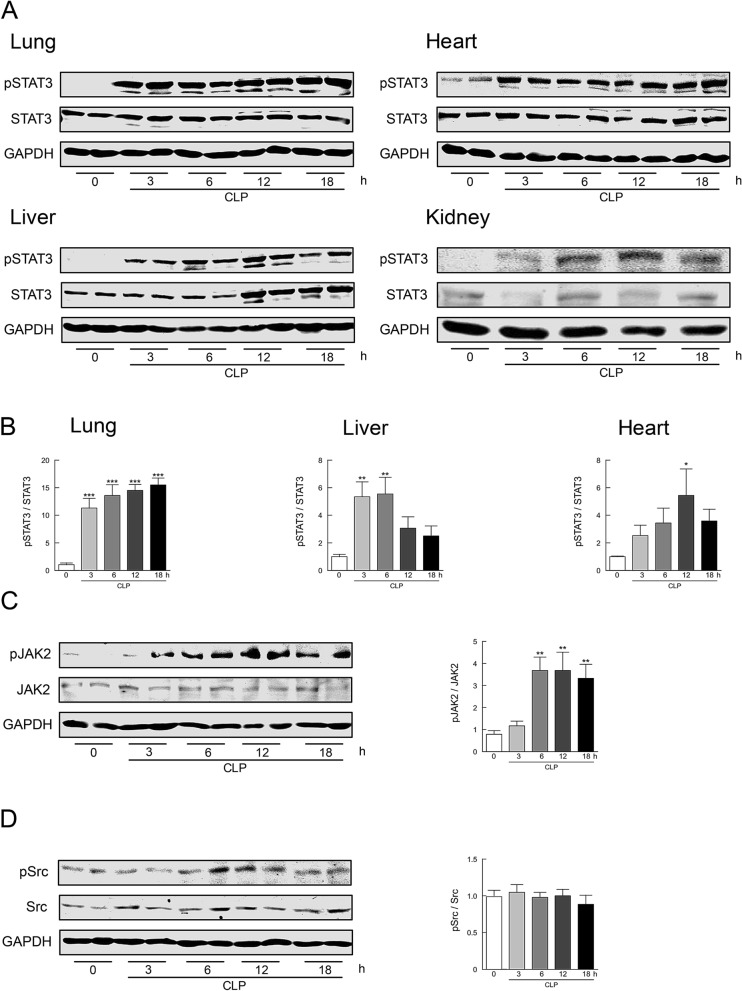
Figure 1.
Activation of STAT3 in mouse tissues following CLP-induced sepsis. (A) Time course of changes in STAT3 phosphorylation in lung, liver, kidney, and heart tissues after CLP. Representative Western blots of phospho-STAT3 at Tyr-705 and of total STAT3 are shown. (B) The summarizing data obtained in lung, liver, and heart tissues are presented as phospho-STAT3/STAT3 expressed relative to the respective control (sham-operated) (n = 8). (C) Time course of phosphorylation levels of JAK2 at Tyr-1007 and Tyr-1008 in liver tissues were quantified by Western blot analysis (n = 8). (D) Time course of phosphorylation levels of Src at Tyr-416 in liver tissues were quantified by Western blot analysis (n = 8). Typical Western blots are shown in the left side and the summary of quantification of densitometric measurement as a ratio of phosphorylated molecule relative to total expression is presented in the right side of each panel. GAPDH served as loading control. *P < 0.05, **P < 0.01, and ***P < 0.001 compared with sham-operated control (0 h).

