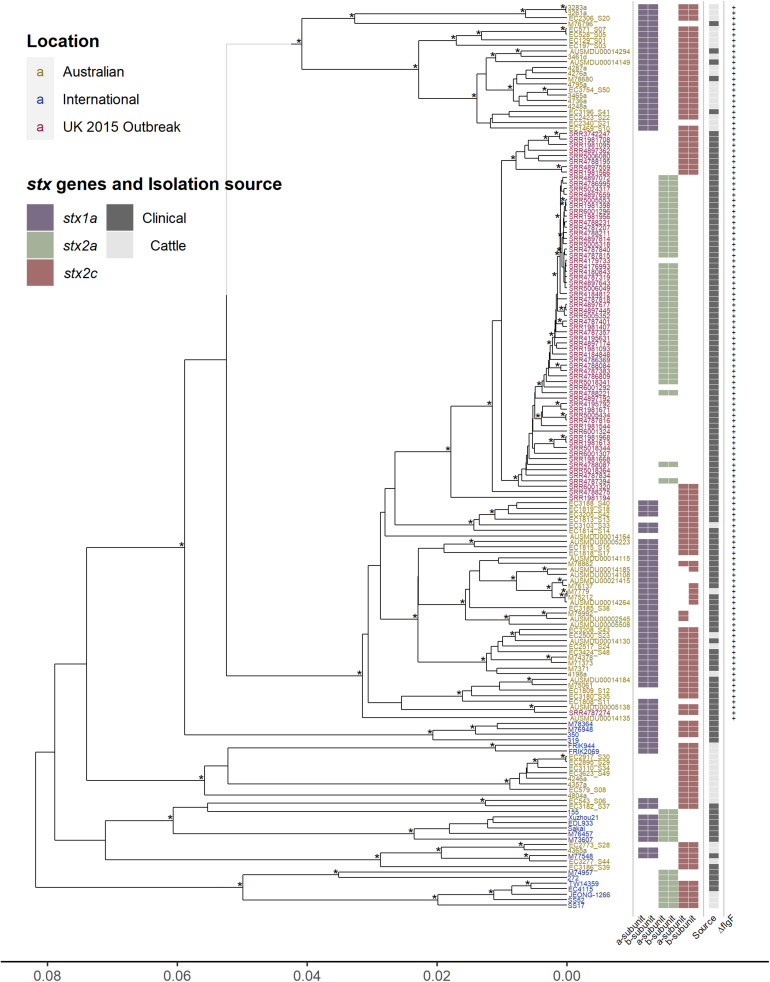
FIGURE 1.
Hierarchal cluster tree of serogroup O157 STEC genomes based on the Jaccard distance of SNP differences identified by mapping all isolates to the AUSMDU00002545 genome as a reference. Asterisk indicates bootstrap support of >95%. Isolates labeled in yellow are Australian, isolates in blue are international, and isolates in red are associated with the United Kingdom 2015 outbreak. Indicated to the right of the tree are; the subtype of both the A and B subunits of the Shiga toxin genes, purple for stx1a, green for stx2a, and red for stx2c; whether the isolates were clinically isolated (dark gray), or from cattle (light gray); and whether the isolates carry the single cytosine base inserted at 125 nt of the flgF gene, indicated by the presence of a plus sign.

