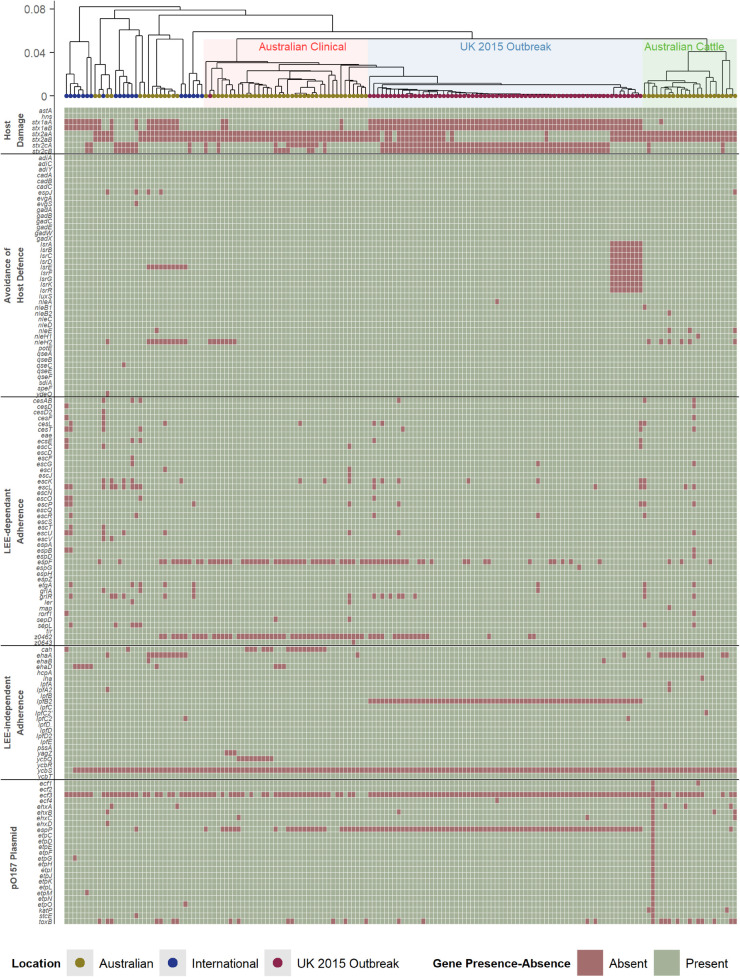
FIGURE 2.
Hierarchal cluster tree as shown in Figure 1, highlighting the Australian clinical isolates in red and United Kingdom outbreak isolates in blue. Below the tree is a heatmap indicating the presence (green) and absence (red) of genes reported to be associated with virulence in STEC. The virulence genes have been categorized into difference pathogenic processes involved in STEC pathogenesis.

