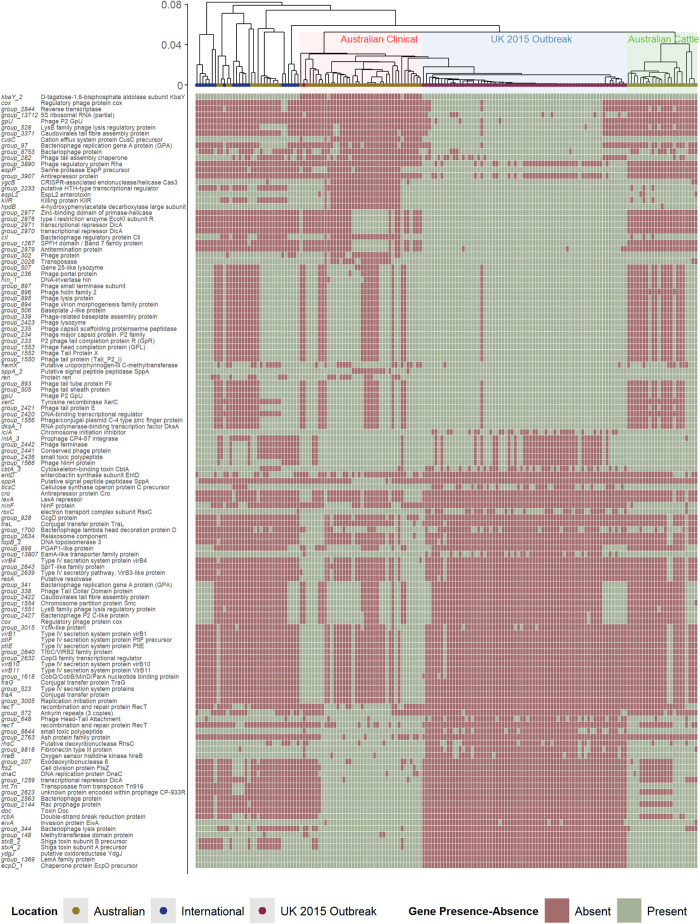
FIGURE 3.
Hierarchal cluster tree as shown in Figure 1, highlighting the Australian clinical isolates in red and United Kingdom outbreak isolates in blue. Below the tree is a heatmap indicating the presence (green) and absence (red) of accessory genes found to be significantly different in their presence and absence between Australian clinical and United Kingdom outbreak isolates.

