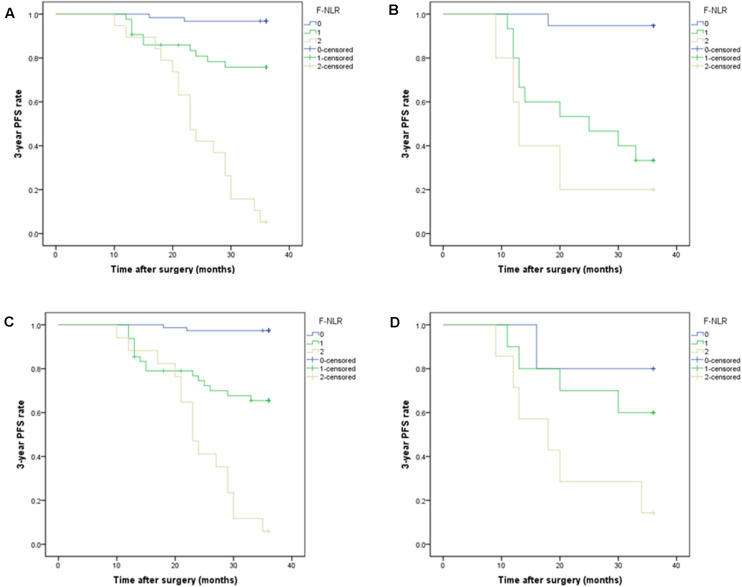
FIGURE 4.
(A,B) Subgroup analysis of Kaplan-Meier curve of the 3-year progression-free survival rate in patients with different fibrinogen and neutrophil-lymphocyte ratio score from 0 to 2 based on tumor location in the training set. (A) F-NLR score was associated with 3-year PFS in non-skull base tumors, P < 0.001. (B) F-NLR score was associated with 3-year PFS in skull base tumors, P < 0.001. (C,D) Subgroup analysis of Kaplan-Meier curve of the 3-year PFS rate in patients with different F-NLR scores based on extent of resection. (C) F-NLR score was associated with 3-year PFS in patients with Simpson grade I-II resection, P < 0.001. (D) F-NLR score was not associated with 3-year PFS in patients with Simpson grade III-V resection, P = 0.045.

