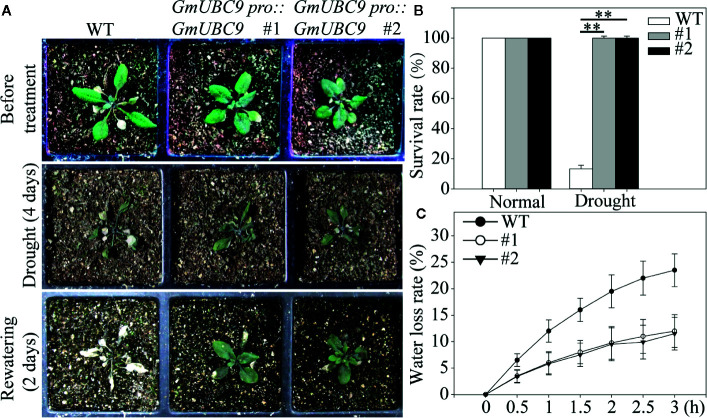
Figure 7.
Drought tolerance phenotypes of WT and GmUBC9 transgenic Arabidopsis in soil. In (A), these lines were planted in a large tray separated by a small compartment. We counted survival rate (B) and water loss rate (C). Data are presented as the mean ± SD of three independent biological replicates. Data are means and standard deviations. **P < 0.01 vs. WT; Student’s t-test.

