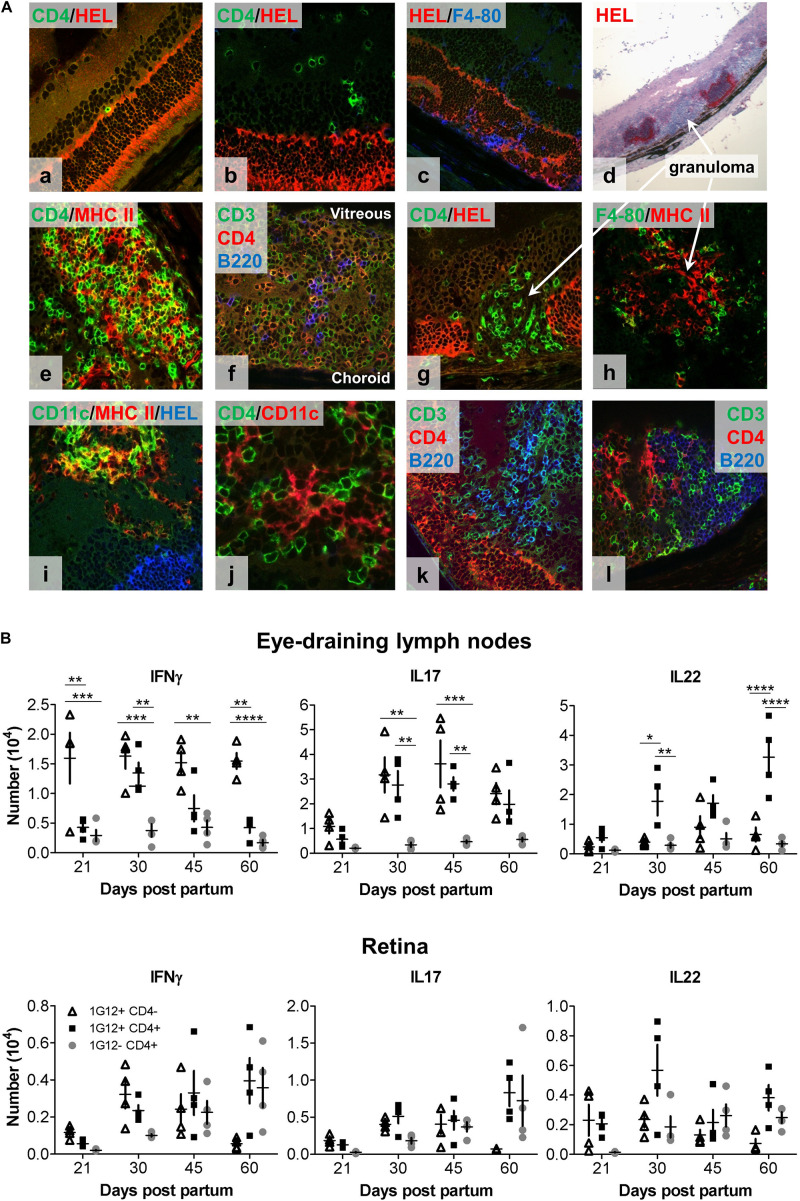
FIGURE 2.
Immunohistology and intracellular cytokine analysis (IFNγ, IL17, and IL22) of eye-draining lymph node- (DLN) and retina-infiltrating cells over the course of spontaneous EAU in dTg HEL/TCR mice. (A) Representative confocal fluorescent (a–c,e–l) and light microscopic (d) immunohistochemistry of frozen retinal sections from (P24) dTg HEL/TCR mice are shown. Sections are representative of initial retinal inflammatory changes (a–c) and advanced retinal inflammatory damage (d–l). Infiltrating cells identified include: (a,b,f,k,l), CD3+CD4+ double-stained T cells, CD3+CD4- single-stained, presumed double-negative (DN) T cells; (c,h), macrophages (F4/80+); (e,i), MHC class II+ and CD11c+ (presumed DC); and (f,k,l), B cells. In panels (d,g,h) granulomas are shown. In panels (f,k,l), granulomas have features of tertiary lymphoid organs (TLO). Areas of retinal HEL protein expression were identified using a polyclonal HEL-specific antibody. The slides were mounted with HydromountTM Aqueous Non-fluorescing Mounting Media (National diagnostics, Hull, United Kingdom), and were examined with a Zeiss LSM510 confocal microscope (Carl Zeiss Meditec, Göttingen, Germany). (B) Flow cytometric analysis of intracellular cytokine expression in lymph node cell populations at different stages of EAU development. Single cell suspensions were prepared from eye-draining lymph nodes (upper panel) and retinas (lower panel), respectively (n = 4/age group). Flow cytometric analysis of intracellular cytokine expression by three different T cell populations (1G12+CD4-, 1G12+CD4+, and 1G12-CD4+) at different time points during evolution of EAU in dTg mice was completed. Upper panel (dTg DLN): at disease onset (P21), only small numbers of antigen-specific CD4+ cells gave a positive signal for intracellular cytokines; a gradual up to fivefold increase was found by P30. Significantly fewer IFNγ-secreting antigen-specific CD4+ T cells (declining further toward P60) than IL17+ and IL22+ cells were found. In contrast, levels of IL17+ cells were sustained in the DLN through P60. IL22 expression was also sustained and increased in CD4+ but not DN HEL-specific T cells through P60. CD4+ non-antigen-specific T cells (1G12-) were low for all three cytokines over the course of the observation. Lower panel (dTg retina): Cytokine expression by cells mirrored those changes found in the DLN except at P45 when there were proportionately more non-antigen specific IL22+CD4+ T cells found in the retina. By P60 non-antigen-specific CD4+ T cells in the retina expressed similar levels of IL22 and IL17 as antigen-specific cells, which suggests some level of bystander activation. Cells had been stimulated with 50 ng/ml PMA and permeabilized with 1 μM ionomycin for 5 h in the presence of monensin (BD GolgiStopTM, BD Biosciences, Oxford, United Kingdom). The cells were surface labeled for CD4 and 1G12 (3A9 TCR) followed by intracellular cytokine labeling for IFNγ, IL17 and IL22. 1 × 10⁵ events/sample were acquired on a BD LSR II flow cytometer. Data were analyzed for each specific time point using one-way ANOVA and Tukey’s Multiple Comparison post hoc Test with *p < 0.05, **p < 0.01, ***p < 0.001, ****p < 0.0001 on a 95% level of confidence. Cell numbers are the average of 4 pairs of retina or DLN, i.e., cell count/pair. 1 × 10⁵ total events were recorded. Total numbers provided were extrapolated based on total cell counts, determined using a Coulter cell counter prior to sample processing.

