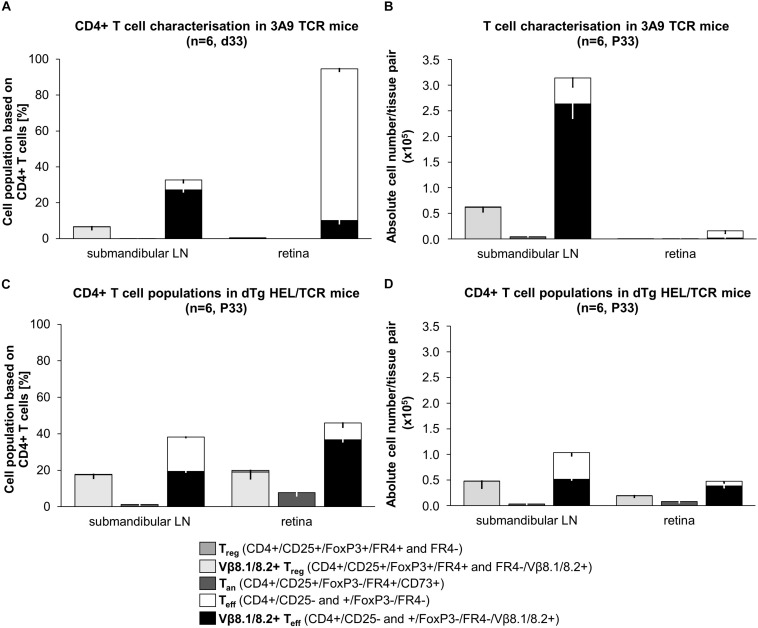
FIGURE 6.
Snapshot phenotypic analysis of T cell populations in 3A9 TCR vs. dTg HEL/TCR mice at peak of EAU (P33). T cells isolated from submandibular (eye-draining) lymph nodes (LN) and retina from (A,B) 3A9 TCR, and (C,D) dTg HEL/TCR mice were evaluated by flow cytometry (BD LSR Fortessa). Anergic T cells (Tan) are CD25+FoxP3-CD73+FR4+; regulatory T cells (Treg) are CD25hiFoxP3+FR4±; effector T cells (Teff) are CD4+CD25±FoxP3-. Antigen-specific cells are Vβ8.1/8.2+ (surrogate marker). Data are expressed as (A,C) percentages (%) relative to CD4+ T cells (dTg LN: 17.8% Treg, 17.5% Vβ8.1/8.2+ Treg, 1.2% Tan, 38.2% Teff, 19.4% Vβ8.1/8.2+ Teff; dTg retina: 19.9% Treg, 19.0% Vβ8.1/8.2+ Treg, 7.8% Tan, 45.9% Teff, 36.7% Vβ8.1/8.2+ Teff; 3A9 TCR LN: 6.7% Treg, 6.6% Vβ8.1/8.2+ Treg, 0.5% Tan, 32.7% Teff, 27.2% Vβ8.1/8.2+ Teff; 3A9 TCR retina: 0.5% Treg, 0.08% Vβ8.1/8.2+ Treg, 0.03% Tan, 94.6% Teff, 10.2% Vβ8.1/8.2+ Teff) and (B,D) as absolute numbers (n) of CD4+ T cell populations per sample (i.e., per pair of retina or LN). Data are presented as the average of 6 pairs or retina or 6 pairs of lymph nodes (1 pair each/mouse), extrapolated based on total cell counts, determined using a Coulter cell counter prior to sample processing. Lymphopenia, in dTg mice is reflected in the comparably low absolute CD4+ T cell numbers in lymph nodes (D vs. B). As expected, no Treg or Tan cells are present in retinas of 3A9 mice (A,B). P33 dTg HEL/TCR mice with EAU have high numbers of Vβ8.1/8.2+ Teff cells in their retinas (C,D). Treg and Tan are also present in large numbers (i.e., five- to six-fold those of 3A9 TCR mice) despite the presence of severe EAU. On a 95% level of confidence, the 2-samples Wilcoxon-Mann-Whitney rank sum test confirmed significant tissue-specific differences in both percent of CD4+ cells and absolute numbers of CD4+ cells between genotype groups (submandibular LN: Treg% CD4+ p0.004, Tan% CD4+ p0.003, Teff% CD4+ p0.004, Vβ+ Teff% CD4+ p0.004; Teff n CD4+ p0.004, Vβ+ Teff n CD4+ p0.004; retina: p0.004 for each of the cell populations, expressed as both% of CD4+ and absolute numbers, n). For ease of reading, stacked bar charts presenting means ± SD are provided (n = 6/genotype).

