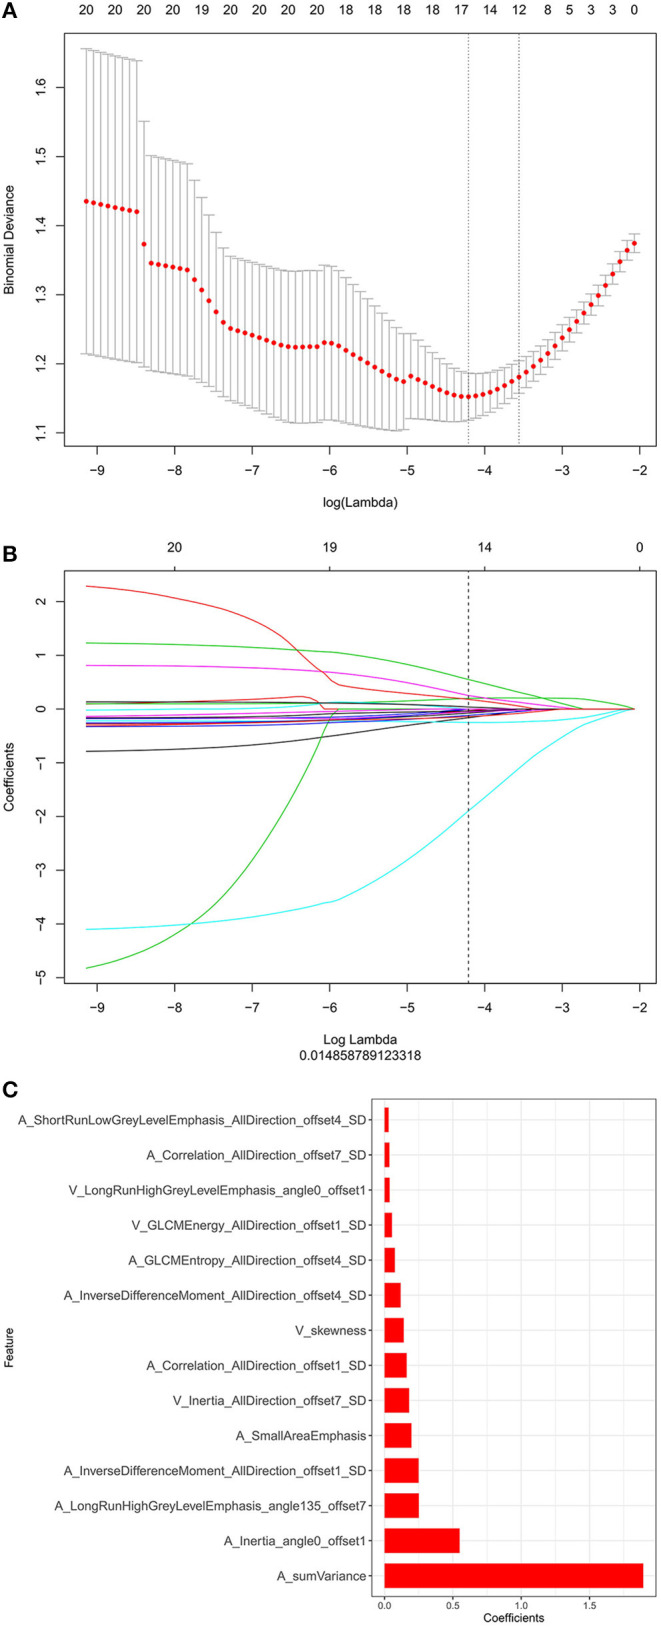
Figure 3.

(A) The binomial deviation from the lasso regression cross-validation model is plotted as a log (λ) function by using the 10-fold cross-validation method. The y-axis represents binomial deviation, the lower x-axis represents log (λ), and the numbers above the x-axis represent the average number of predictive variables. The red dot represents the average deviation value of each model with a given λ, while the vertical bar of the red dot represents the upper and lower limit values of the deviation. The vertical dotted line represents the log (λ) value corresponding to the best λ value; the selection standard is the minimum standard. By adjusting different parameters (λ), the binomial deviation of the model is minimized, and the feature datasets with the best performance are selected. (B) Plots the coefficients of the log (λ) function. The λ value is the smallest at the dotted line. Select the coefficient that is not 0 here as the coefficient of the last reserved feature. (C) The y-axis shows the 14 feature names with non-zero coefficients retained at the minimum value of λ, and the x-axis shows their total coefficients in the lasso Cox analysis. The larger the coefficients are, the greater the predictive significance.
