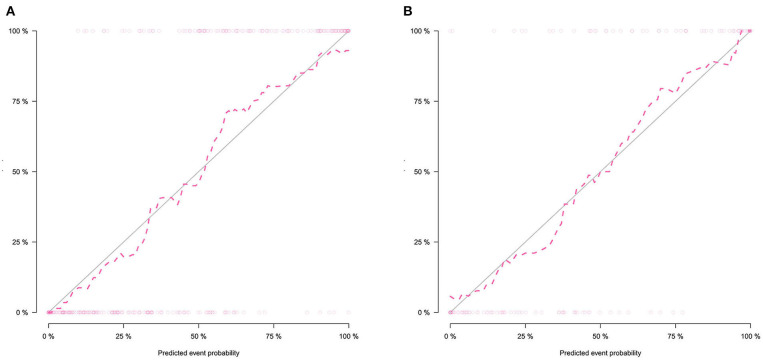
Figure 7.
Calibration curves of the radiomics nomogram in the training set (A) and validation set (B). The calibration curves show the calibration of the nomogram in terms of agreement between the predicted probability of SCLC and pathological findings. The 45° blue line indicates perfect prediction, and the dotted lines indicate the predictive performance of the nomogram. The closer the dotted line fit to the ideal line, the better the predictive accuracy of the nomogram.

