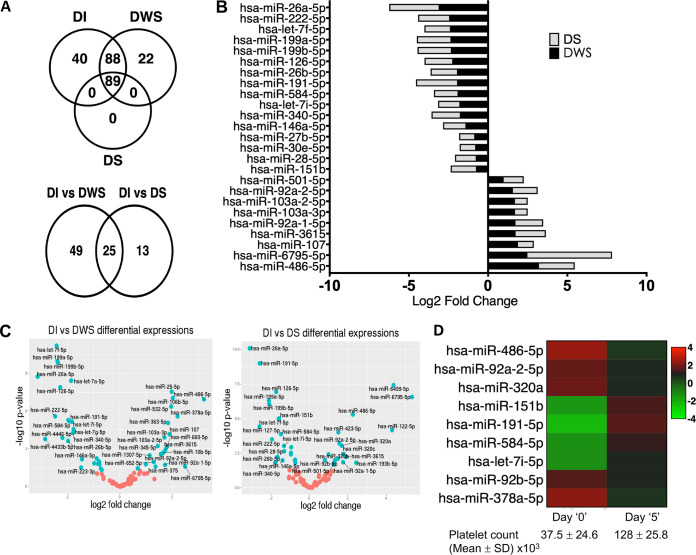
FIG 2.
Plasma miRNA profiling of dengue-infected patients. (A) Venn diagram of common and unique miRNAs detected in DI, DWS, and DS patients (upper panel). The number of differentially expressed miRNAs in DWS and DS groups compared to DI (lower panel). (B) Expression pattern of 25 miRNAs differentially expressed in DWS or DS versus DI patients shown as log2 fold change. (C) Volcano plots showing changes in the expression levels of miRNAs between DWS and DI groups and between DS and DI groups. The log2 fold change is depicted on the x axis, and log10 P values are shown on the y axis. The P values were calculated using the Student t test. (D) Heatmap of 9 miRNAs differentially expressed in plasma of the DS group of patients and the convalescent patients.

