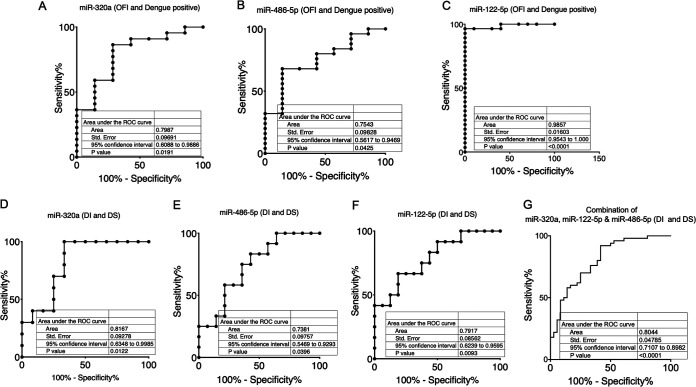
FIG 4.
Receiver-operating characteristic (ROC) curve analysis. ROC curve analysis was carried out for differentiating between OFI and dengue infection or within the DI and DS groups of dengue patients. Sensitivity is plotted as a function of specificity for the different miRNAs. The area under the curve (AUC) is a measure of how well a quantitative test can distinguish between the two groups. (A to C) ROC for OFI (n = 7) versus all dengue patients (n = 26) is plotted. (D to G) ROC for DI (n = 14) versus DS (n = 12) groups for each of the three miRNAs is plotted either individually or together in the plasma of dengue patients.

