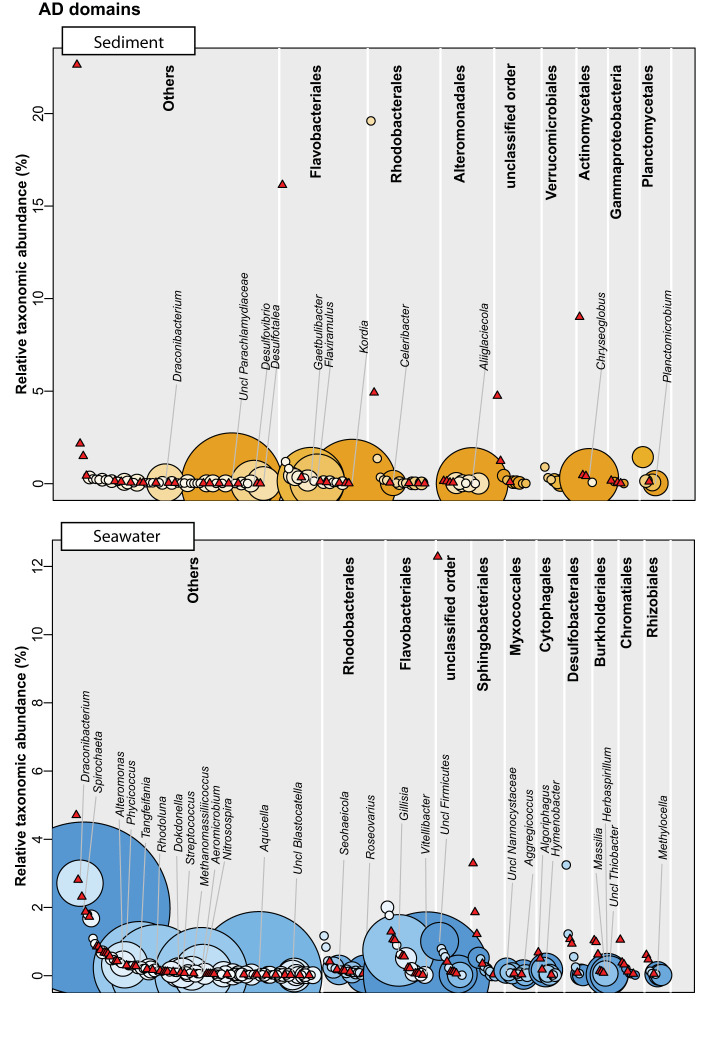
FIG 4.
Correlation between genera and AD OBUs in either sandy sediment or seawater (eDNA) samples based on the linear model with P value < 0.001. Species are grouped at genera level and arranged into top 9 most abundant orders and the remaining orders as “Others.” Each genus is plotted according to the relative taxonomic abundance (16S rRNA V3V4 gene diversity) and assigned with the magnitude of the matched AD domain potential (bubbles). Red triangles represent genera with no AD domain correlations. Classified genera with more than five AD OBUs are shown on the plot.

