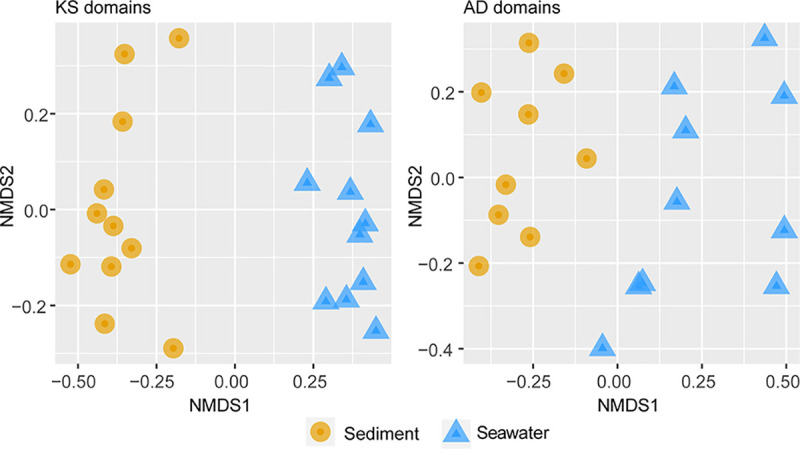
FIG 8.

Grouping of the cultivated samples (pDNA) from coastal sediment (yellow circles) and seawater (blue triangles) based on nonmetric multidimensional scaling (NMDS) ordination. Analysis of AD and KS domain based on Bray-Curtis dissimilarities was performed. Differences between the two groups were tested by PERMANOVA (P = 0.001).
