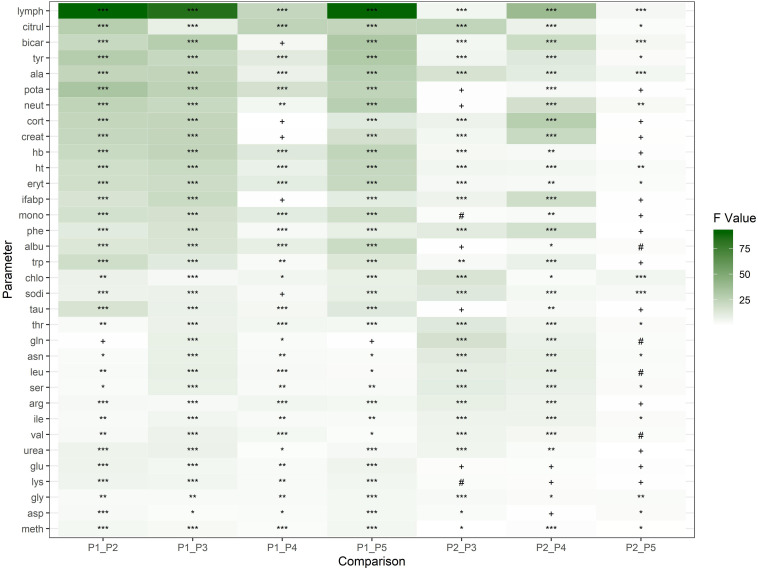
FIGURE 3.
Heatmap representing effect sizes of 34 parameters as calculated by the multilevel mixed effects model. The parameters are shown in rows. All exercise protocols (P2–P5) are compared to the rest condition (P1) and to each other. The protocol effects of these comparisons are represented as contrasts (F values 0–100) in columns by green-shaded blocks. Significant p values are depicted by asterisks (*): *p < 0.05, **p < 0.01, ***p < 0.001. The p values in the range of 0.05–0.1 (#) and 0.01–1 (+) are considered to be not statistically significant.

