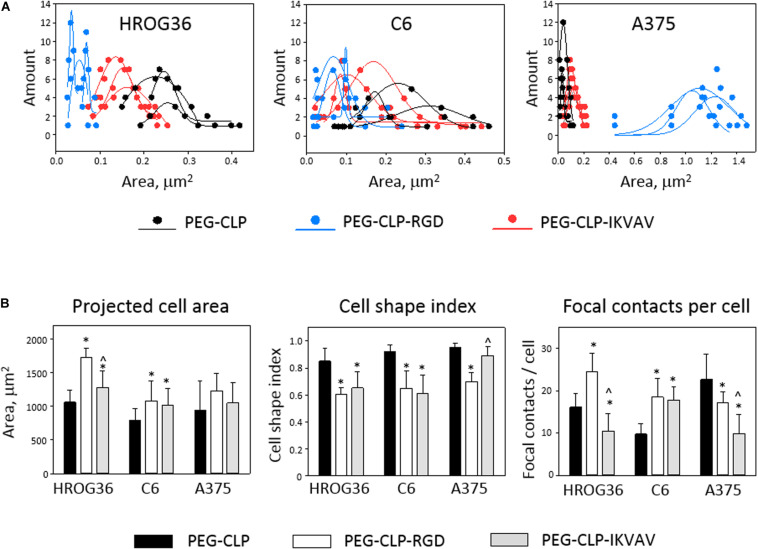
FIGURE 6.
Size distribution of individual focal contacts (A), projected cell area, cell shape index, and number of focal contacts (B) of HROG36, C6, and A375 cells on PEG-CLP, PEG-CLP-RGD, and PEG-CLP-IKVAV hydrogels. The cells were immunostained for F-actin (red signal) and vinculin (green). Nuclei were visualized blue by DAPI. Size distribution of focal contacts of three cells on each hydrogel was plotted together with approximate distribution curve. Projected cell area and perimeter for cell shape index calculation were measured by ImageJ software. Focal adhesion number per cell was calculated according to the number of vinculin-actin colocalization points. The data are presented as AVG ± SDEV of 5–7 cells from three of each hydrogel sample. *Indicates statistically significant difference compared with the samples of the same cell type grown on PEG-CLP, ∧ – compared with samples on PEG-CLP-RGD. ANOVA with post hoc LSD test, p < 0.05.

