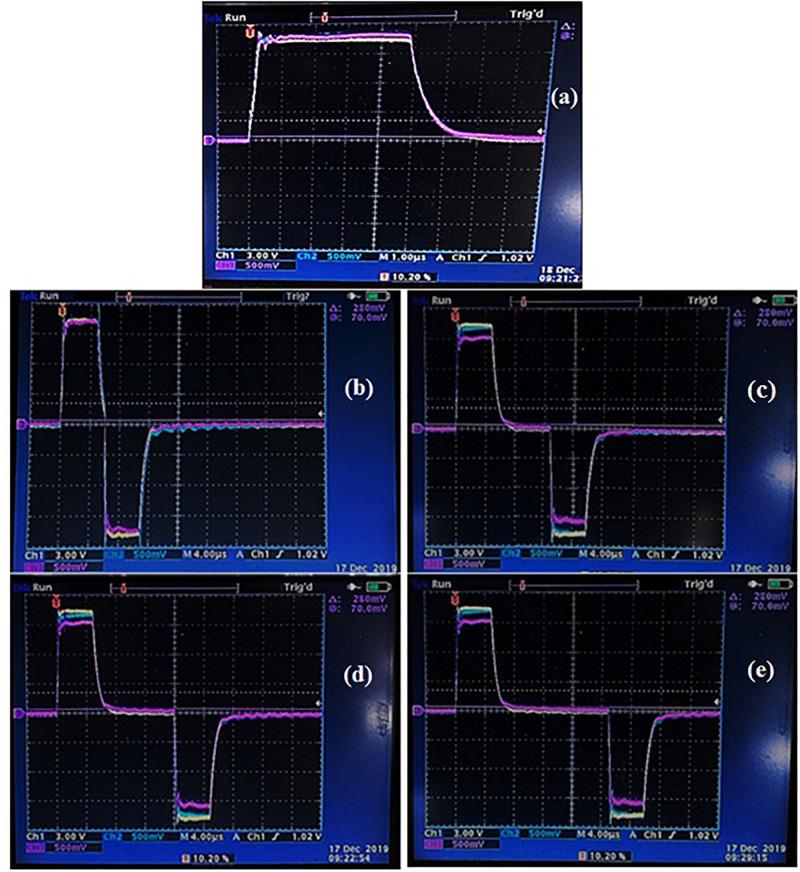
FIGURE 1.
Typical voltage and current waveforms captured at the treatment chamber for either monopolar (a) or bipolar pulses at different delay time of 1 μs (b), 5 μs (c), 10 μs (d), and 20 μs (e). Reference color: yellow: voltage waveform; light blue: current waveform at the first module of the treatment chamber; purple: current waveform at the second module of the treatment chamber.

