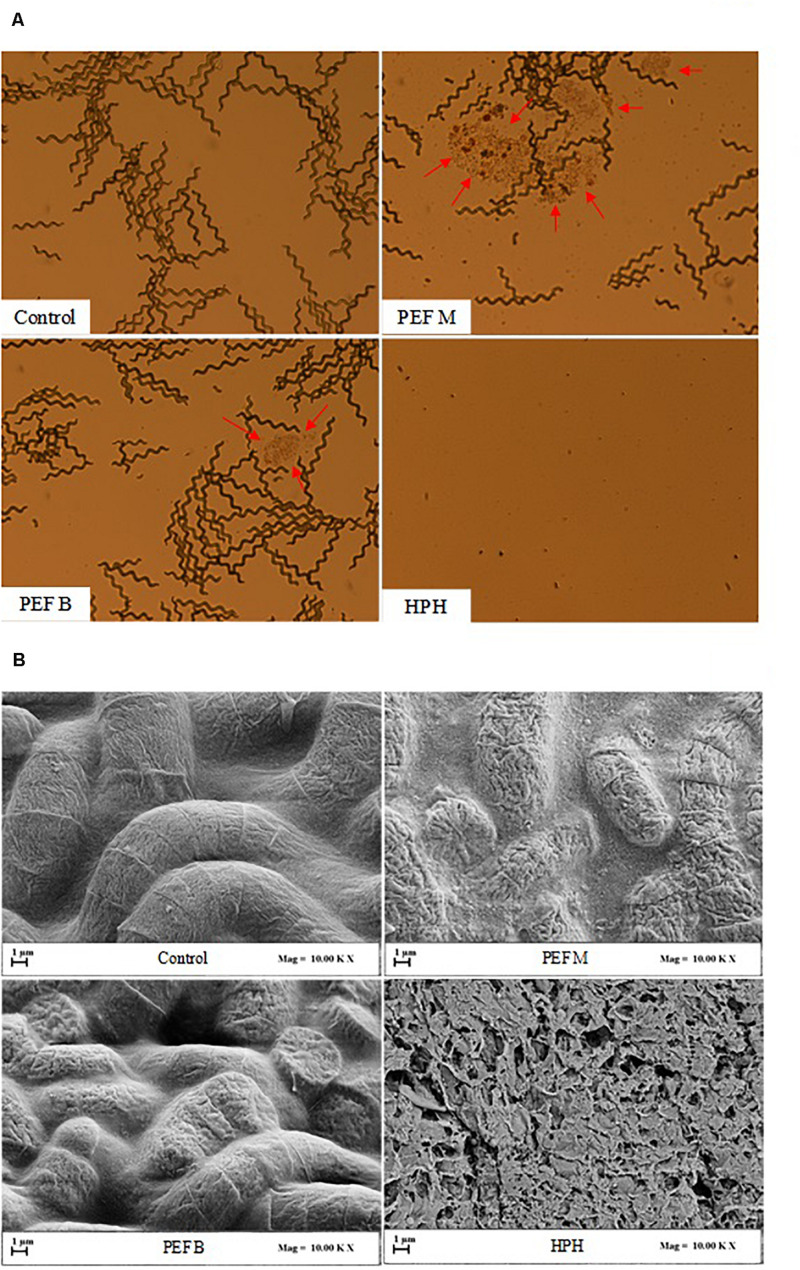
FIGURE 4.
Optical microscopy (20× magnification) (A) and scanning electron microscopy (SEM) (B) of A. platensis cells, before (Control) and after PEF (E = 20 kV/cm; WT = 100 kJ/kgsusp; TIN = 25°C) using either monopolar (PEF M) or bipolar (PEF B) pulses, and HPH (P = 150 MPa; nP = 3) treatment. Red arrows indicate release of intracellular material.

