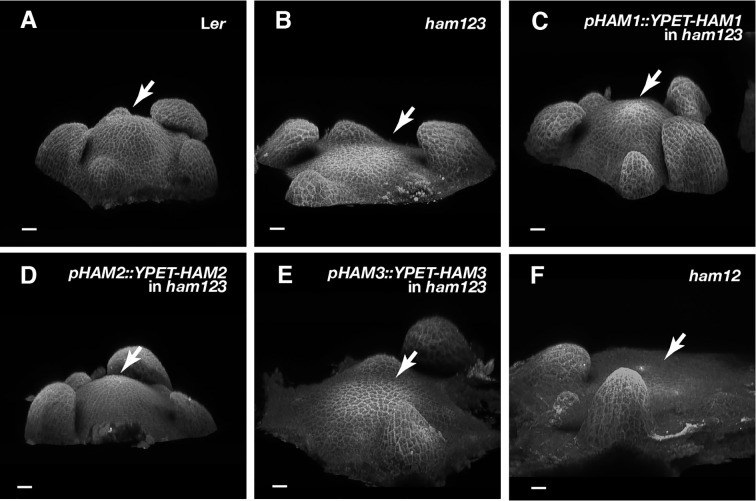
Figure 6.
Roles of different HAM genes in control of vegetative SAM morphology. (A–E) 3D projection views of the vegetative SAMs of indicated genotypes are shown. Ler wild type (A), ham123 (B), pHAM1::YPET-HAM1 in ham123 (C), pHAM2::YPET-HAM2 in ham123 (D), pHAM3::YPET-HAM3 in ham123 (E), and ham12 (F) were grown in the short days and imaged at the same age (28 DAG). Four biological replicates were performed for each genotype with similar results. Arrows indicate center of the SAMs. Scale bar: 20 µm.

