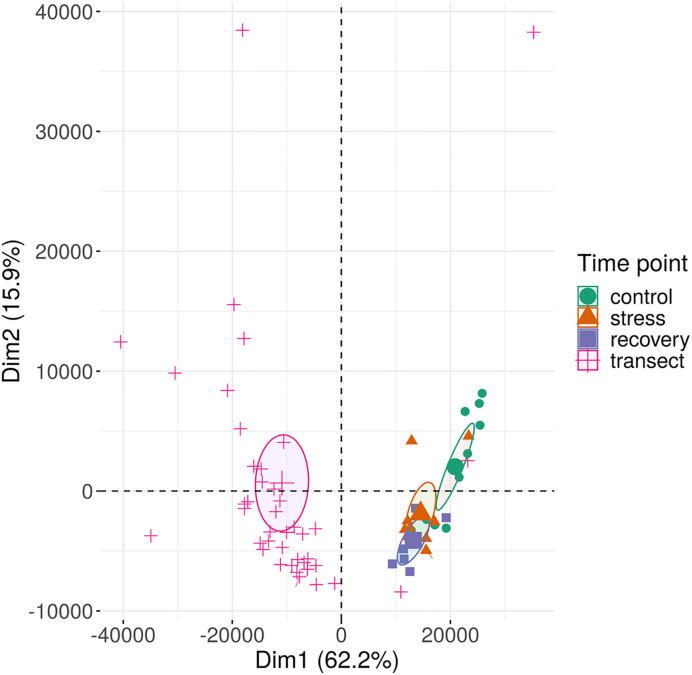
Figure 4.
Methylation variation of field transect samples and of experimental samples of Zostera marina along the first two principal components. The samples (small symbols) are plotted along the first two principal components (Dim) based on methylation profiles across all sequence contexts. Circles represent 95% confidence intervals around group means (large symbols). Bracketed numbers represent the percentage of explained variation.

