
Figure 9.
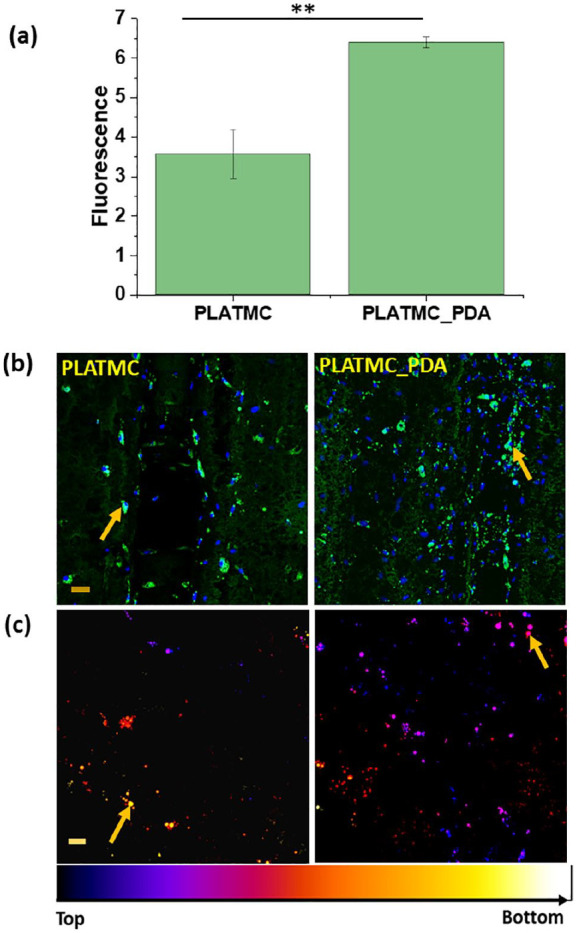
Adipogenic differentiation after 21 days of culture in adipogenic medium seeded onto the 3D printed scaffolds. (a) Quantification of lipid droplets (intracellular triglyceride) using AdiopoRedTM assay (**p < 0.01). (b) Confocal images of the stained lipid droplets (green) and nucleus (blue). (Scale bar 50 µm (10x)) (c) Temporal color-coded representation of lipid droplets showing the distribution of lipid droplets on and inside the scaffolds (Scale bar 20 µm (20x)). Different colors were given using ImageJ.