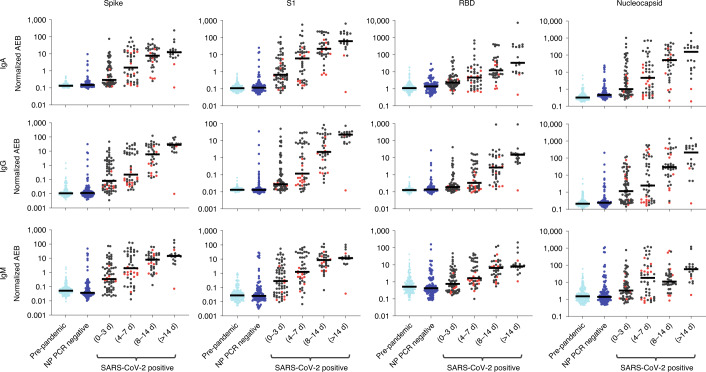
Fig. 2. Profiling seroconversion in COVID-19.
Simoa serological assay results for IgG, IgM and IgA against the four viral targets (spike, S1 subunit, RBD and nucleocapsid) for pre-pandemic samples (light blue; n = 200), nasopharyngeal (NP) PCR-negative samples (dark blue; n = 100) and SARS-CoV-2-positive samples (black (immunocompetent; n = 141) or red (immunosuppressed; n = 31)). The SARS-CoV-2-positive samples were divided into four groups according to time since since the first positive nasopharyngeal RT–PCR test. Black lines indicate the median normalized AEB value of each population.

